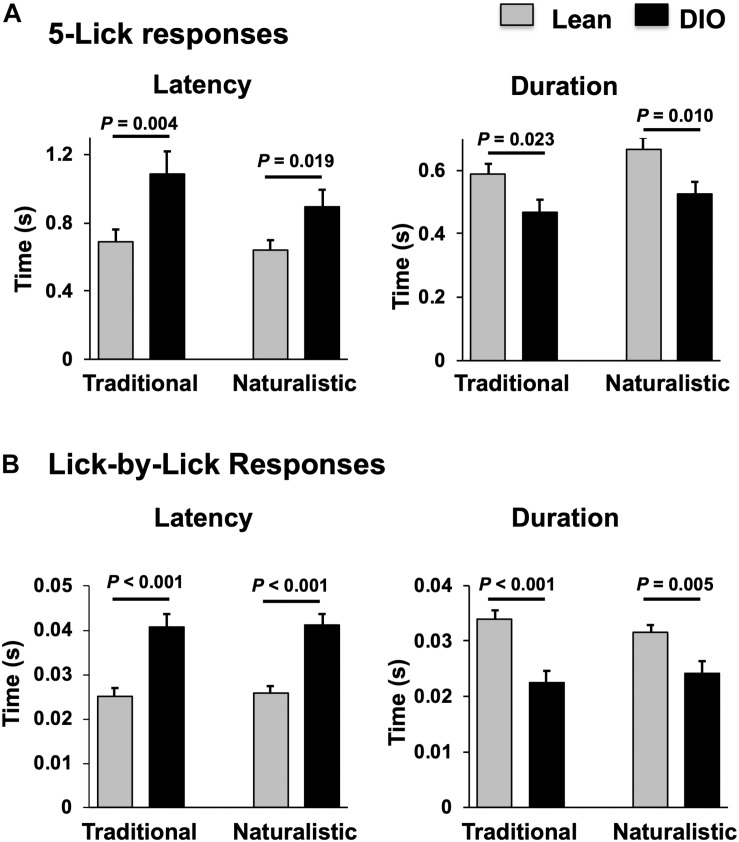
FIGURE 8.
Comparison of latency and duration of NTS taste responses in lean and DIO rats. (A) Mean (+SEM) values of response latency (left) and duration (right) of 5-lick responses in lean and DIO rats. (B) Mean (+SEM) values of response latency (left) and duration (right) of lick-by-lick responses in lean and DIO rats. Values across lean and DIO groups were comparedusing a Student’s t test; p values are shown for each comparison. Both 5-lick and lick-by-lick NTS taste responses in DIO rats showed significantly longer latencies and shorter durations than those in lean rats.

