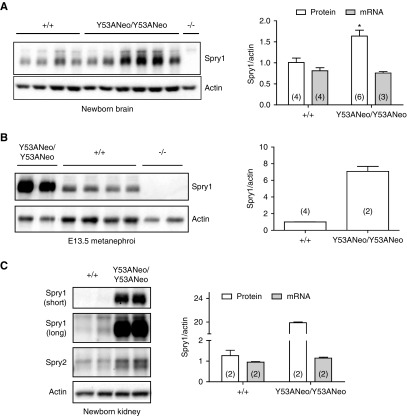
Figure 2.
Expression of wild-type and mutant Sprouty1. (A) Levels of Spry1 from newborn brains of the indicated genotypes were measured by Western blot (left panel). Right panel, quantification of protein and mRNA levels from newborn brains of the indicated genotypes. Equal mRNA levels indicate that regulation of protein levels by tyrosine 53 is post-transcriptional. *P=0.11, Mann–Whitney test. (B) Protein levels of E13.5 kidneys from the indicated genotypes. Note the much higher levels in knockin metanephroi. (C) Sprouty1 protein and mRNA levels of newborn kidneys from the indicated genotypes. Short and long exposures of Sprouty1 immunoblots are shown to illustrate the difference between genotypes. Levels of Sprouty2 are included for comparison. The number in parentheses indicate sample number in all graphs.

