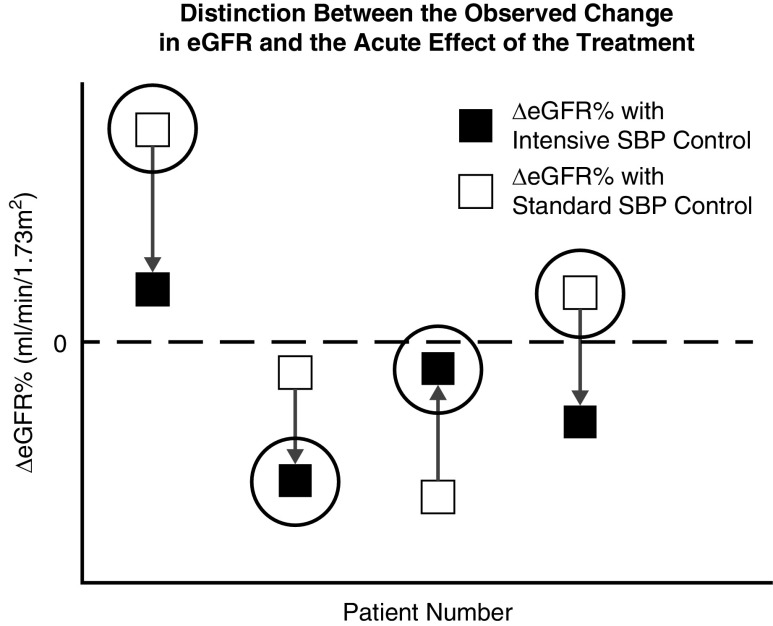
Figure 1.
Distinction between the observed change in eGFR and the acute effect of the treatment. Shown are percent changes in eGFR from baseline to 6 months under the standard SBP intervention (open squares) and under the intensive SBP intervention (solid squares) for four hypothetical participants. The difference in these changes between the intensive and standard SBP interventions (represented by the vertical arrows) define the acute effects of the treatment for these four patients. We actually observe the change in eGFR for only one of the two interventions, depending on each patient’s randomly assigned treatment (depicted by the large open circles). We cannot observe the acute effect in any individual participant, but instead can observe the percent change in eGFR only under the participants’ assigned interventions. The direction and magnitude of the acute effects may deviate from the direction and magnitude of the observed percent changes in eGFR. The indirect effect of the treatment which is mediated by change in eGFR is the difference in the outcome that results if the acute change in eGFR is modified by the amounts indicated by the vertical arrows.

