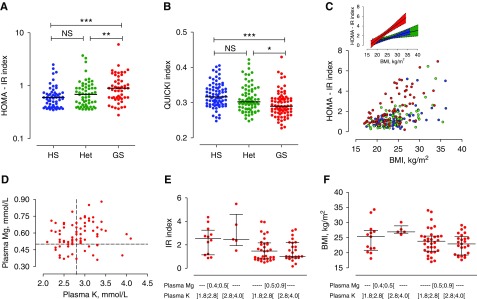
Figure 2.
Resistance to insulin in the three groups. (A) IR index, (B) QUICKI, and (C) relationship between IR index and BMI in HS (blue), Het (green), and GS (red) groups. The inset shows semilog linear regression of this relationship and their 95% confidence bands. (D) Relationship between plasma potassium and plasma magnesium in patients with GS. (E) IR index and (F) BMI plotted according to severity of hypomagnesemia and hypokalemia in patients with GS. *P<0.05; **P<0.001; ***P<0.001.

