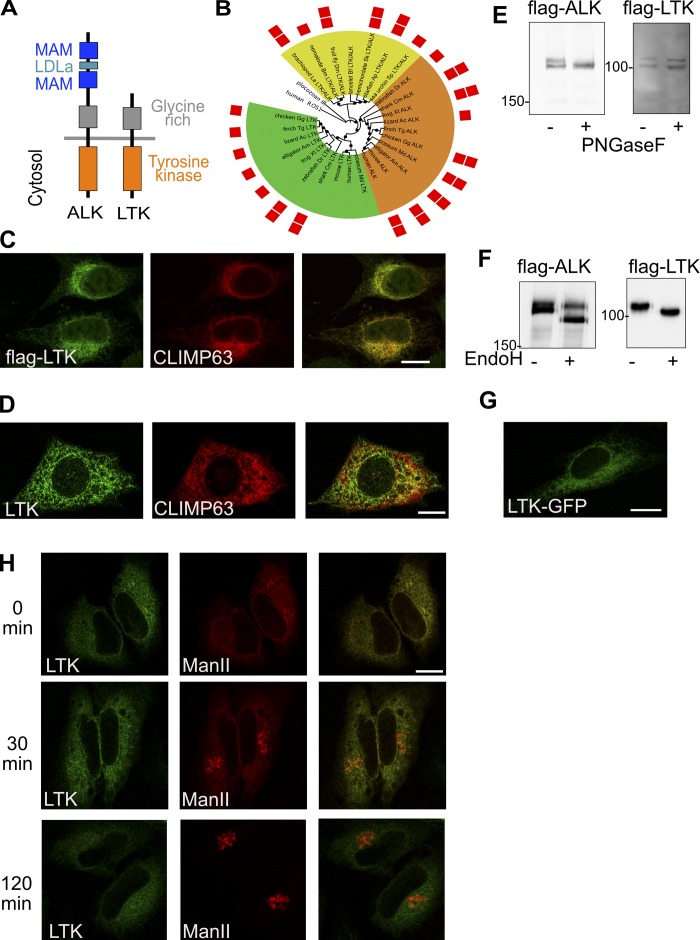
Figure 1.
Subcellular localization of LTK. (A) Schematic illustrating the domains of LTK and ALK. LDLa, low-density lipoprotein (LDL) receptor class A repeat. (B) Phylogenetic tree of ALK and LTK kinase domains. Color ranges highlight invertebrate LTK/ALK-like proteins (yellow), vertebrate ALK proteins (orange), and vertebrate LTK proteins (green). Red squares indicate the presence of one or two MAM domains. Black circles mark branches with bootstrap support above 50%. Human ROS1 and placozoan insulin receptor–like kinase domains are used as outgroup. The list of abbreviations used in the figure can be found in the Materials and methods section. (C) Immunostaining of flag-tagged human LTK and endogenous CLIMP63 in HeLa cells. (D) immunofluorescence staining of endogenous LTK and CLIMP63 in HepG2 cells. (E) HeLa cells expressing flag-tagged LTK or ALK were treated with PNGase F followed by lysis and immunoblotting against flag to detect ALK or LTK. (F) HeLa cells expressing flag-tagged LTK or ALK were lysed and the lysate treated with EndoH followed by immunoblotting against flag to detect ALK or LTK. (G) HeLa cells expressing GFP-tagged LTK were imaged using live microscopy. (H) HeLa cells expressing GFP-tagged LTK and mCherry-tagged Man-II in the RUSH system were treated for 0 or 2 h with biotin followed by fixation. Scale bars are 10 mm.

