Figure 2.
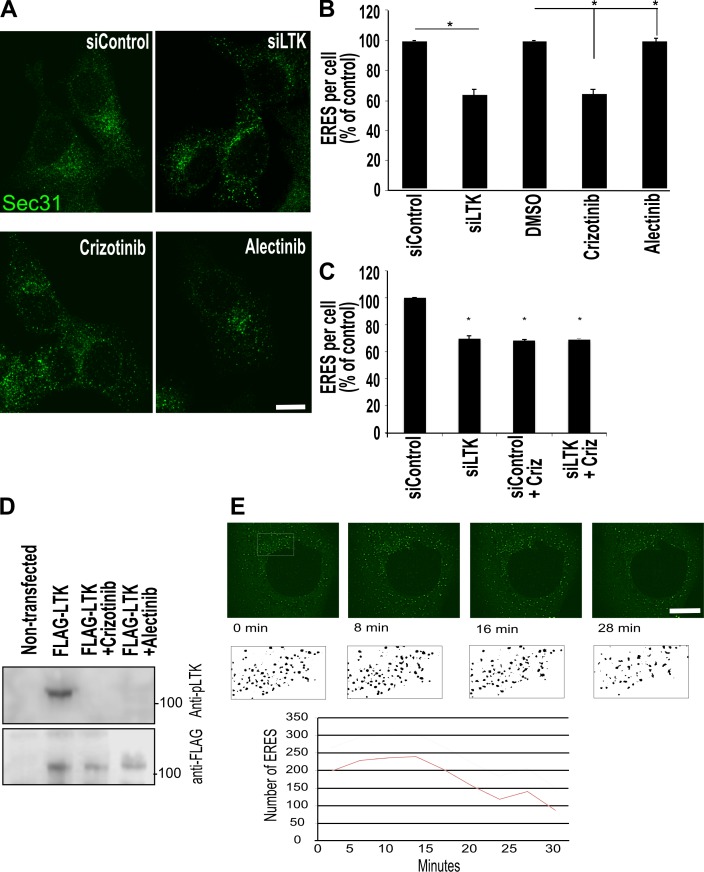
LTK regulates ER export and ERESs. (A) HepG2 cells were either subjected to LTK silencing with siRNA followed by fixation and staining after 72 h, or treated with crizotinib and alectinib (1 µM) for 30 min before fixation and immunostaining against Sec31 to label ERESs. (B) Quantification of ERES number per cell displayed as percentage of control (all values are set as percentage of siControl). Data are from three independent experiments with at least 35 cells per experiment per condition. Asterisk indicates statistically significant differences at P < 0.05. (C) HepG2 cells were transfected with control or LTK siRNA. After 72 h, cells were treated with solvent or with crizotinib (1 µM) for 30 min before staining for Sec31 to determine ERES number. (D) HeLa cells expressing flag-tagged LTK were treated with solvent or with crizotinib or alectinib for 30 min before lysis and immunoblotting as indicated. P-LTK indicates immunoblotting against an antibody that detects phosphorylation on Y672. Flag immunoblotting was performed to determine equal loading. (E) HeLa cells expressing GFP-Sec16A treated with 1 µM crizotinib followed by confocal live imaging. Stills of the indicated time points are depicted. The ERESs in the boxed area are depicted in black and white to enhance visibility. The number of ERESs was counted and is displayed in the lower graph. siLTK, LTK silenced. Scale bars are 10 mm.

