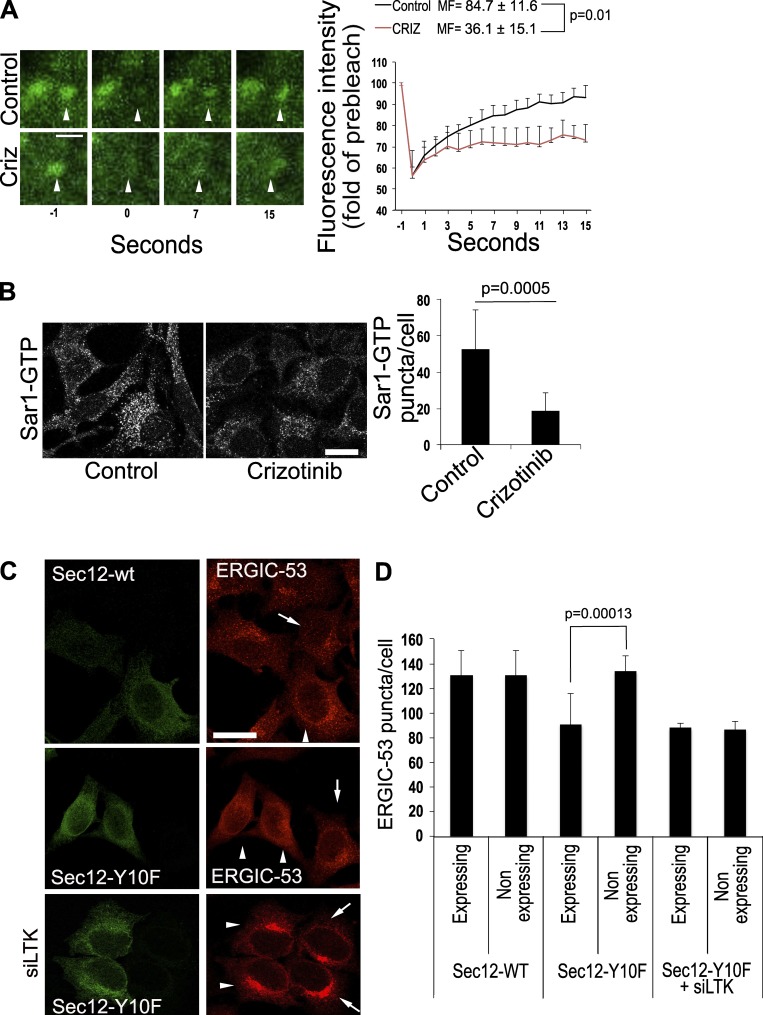
Figure 5.
LTK regulates Sec12 function. (A) FRAP assay of HepG2 cells expressing YFP-tagged Sar1A. Images on the left side show magnified single ERES at different time points before (−1) and directly after (0) bleaching as well as at the indicated time points after bleaching. Graph shows an evaluation of nine FRAP curves for each condition from three experiments. MF, mobile fraction. Scale bar, 1 µm. Criz indicates a condition where cells were treated with 1 µM of crizotinib for 20 min before the FRAP assay. (B) HeLa cells were treated with solvent (Control) or 1 µM crizotinib for 30 min before fixation and immunostaining against Sar1-GTP. The number of Sar1-GTP puncta was counted using ImageJ and is displayed in the bar graph on the right side of the panel. Results represent the average number of puncta per cell obtained from 100–150 cells. Statistical significance was tested using unpaired, two-tailed t test. (C) Wild-type Sec12 or its mutant Sec12-Y10F were expressed in HeLa cells immunostained for ERGIC-53 and flag. siLTK, expression of Sec12 in LTK-depleted cells. Arrows indicate nontransfected cells. Arrowheads indicate cells expressing Sec12. Scale bars, 30 µm. (D) Bar graph showing the quantification of the number of ERGIC-53 puncta per cell from three independent experiments. The graph compares cells expressing the Sec12 construct to directly adjacent nontransfected cells.

