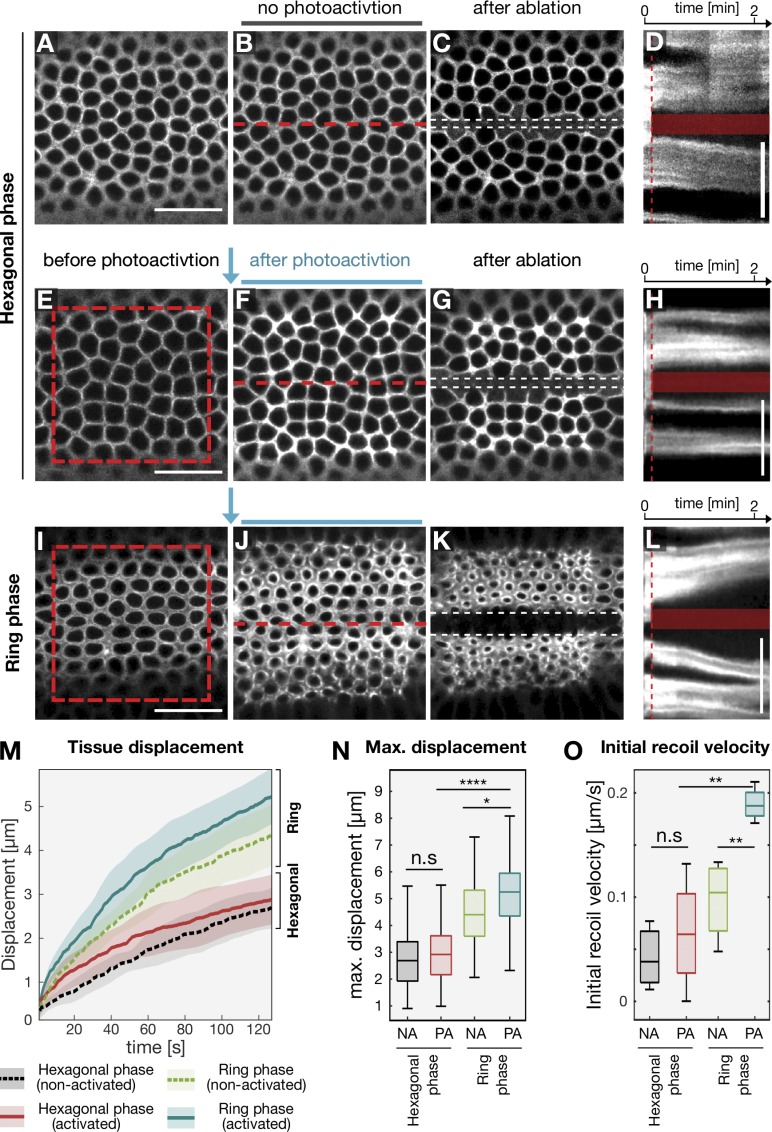
Figure 2.
Actomyosin network configurations display different elastic properties. Laser ablations were performed in Drosophila embryos expressing the RhoGEF2 optogenetic module during the hexagonal phase (A–H) and ring phase (I–L) either without photoactivation (A–D) or after photoactivation (E–L). Panels show the basal actomyosin network at the initial time point (A, E, and I), after photoactivation (F and J), at the corresponding time point without photoactivation (B) or 80 s after laser ablation of the basal network using 800 nm of light (C, G, and K). Scale bars, 20 µm. The position of ablation is indicated by a red dashed line in B, F, and J, and the edges of the recoiled tissue are highlighted by white dashed lines in C, G, and K. (D, H, and L) Kymographs showing tissue displacement over time upon laser ablation. Red dashed lines indicate the time at which laser ablation was performed, and the semitransparent box, the ablated region. Scale bars, 10 µm. (M) Quantification of tissue displacement after laser ablation during the hexagonal phase (nonactivated: dashed black line, n = 3 embryos; after photoactivation: solid red line, n = 4 embryos) or during the ring phase (nonactivated: light green dashed line, n = 4 embryos; after photoactivation: red solid line, n = 4 embryos). Lines indicate mean displacement and semitransparent regions the corresponding SD. At least 10 interfaces were tracked over time per embryos. (N) Boxplot showing maximum tissue displacement (at 125 s after laser ablation). Nonactivated (NA) embryos are compared with photoactivated (PA) embryos during the hexagonal phase and ring phase. Optogenetic stimulation of myosin-II did not result in an increase in tissue recoil during the hexagonal phase, while photoactivation caused a significantly higher (P < 0.05) displacement during the ring phase. Number of tracked interfaces used for analysis: nHex:NA = 36, nHex:PA = 61, nRing:NA = 42, and nHex:PA = 56. (O) Boxplot showing the initial recoil velocity after laser ablation in NA embryos compared with PA embryos during the hexagonal phase and ring phase. The same number of embryos was subjected to analysis as described in M. (N and O) In each box plot, the central mark, the bottom, and the top edge indicate the median and the 25th and 75th percentiles, respectively. Whiskers extend to the most extreme data point. For all panels, when indicated, significances were estimated using nonpaired two-sided Student’s t test with *, P < 0.05; **, P < 0.01; ****, P < 0.0001; and n.s, not significant.

