Figure 6.
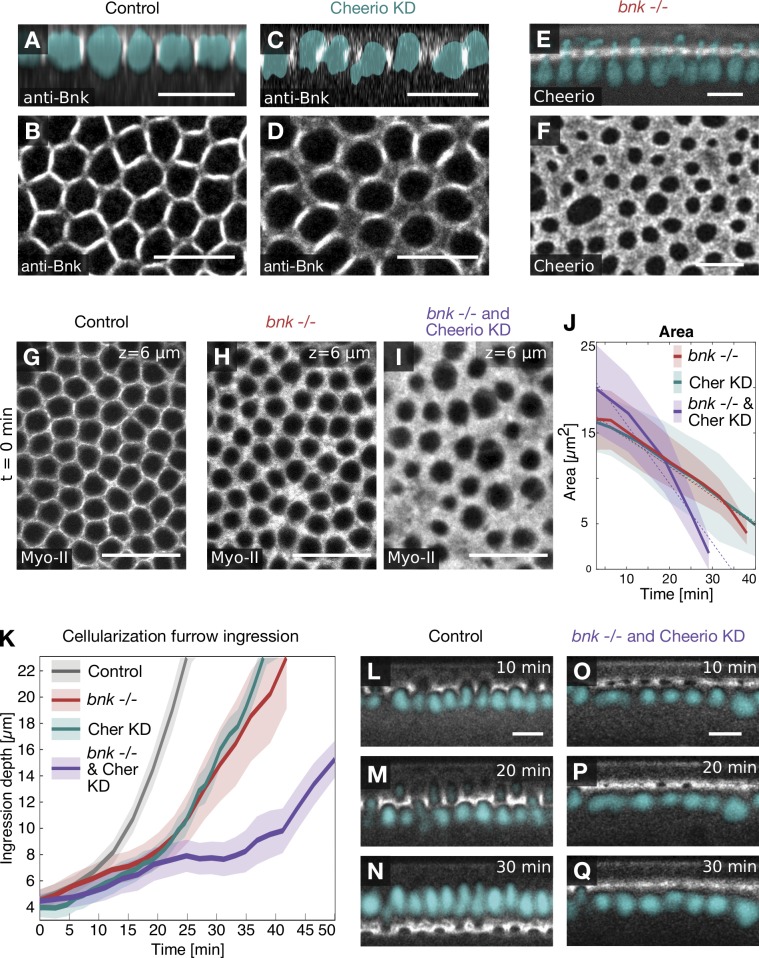
Bnk and Cheerio act synergistically during hexagonal patterning. (A–D) Confocal images of Cheerio KD embryos fixed at different stages of cellularization and immunostained using an antibody against Bnk. Sagittal sections showing the localization of Bnk (grayscale) at the leading edge of the cellularization furrow and position of the nuclei (DAPI; cyan) in control (A) and upon Cheerio KD (C). Top view showing the localization of Bnk in control (B) and in Cheerio KD embryos (D), which lack hexagonal patterning. (E and F) Localization of Cheerio::YFP in a bnk−/− embryo coexpressing Histone::RPF (cyan) shown in a sagittal section (E) or top view of the basal network (F). Upon loss of Bnk, Cheerio still localized to the cellularization front, although in a diffused pattern due to the lack of actin bundles. Scale bars, 10 µm. (G–I) Confocal images of Drosophila embryos expressing the myosin-II marker Sqh::mCh in controls (G and K–M), in bnk−/− (H), or in bnk−/− and Cheerio KD double mutant embryos (I and N–P). Top views showing the basal actomyosin network at an ingression depth (z) of 6 µm in a control (G), in a bnk−/− (H), and in a bnk−/− and Cheerio KD double mutant embryo (I). The bnk mutant phenotype is characterized by the lack of the hexagonal phase, and hypercontractility worsened in embryos in which Cheerio was also knocked down. Scale bars, 20 µm. (J) Graph showing the area of basal openings over time in a bnk−/− (red), a Cheerio KD (green), and a bnk−/− and Cheerio KD double mutant (purple) embryos. A linear function was fitted to the data to estimate the constriction speed. While bnk−/− and Cheerio KD embryos revealed a constriction speed of 0.3 µm2/min, the double mutant constricted with an approximately twofold increased rate (0.65 µm2/min). Solid lines indicate an average value and semitransparent areas the SD. For each condition, individual cell openings were segmented and analyzed (basal openings per data point: 26 ≤ nbnk−/− ≤ 87, 15 ≤ nCheerioKD ≤ 42, 29 ≤ nbnk−/−,CherKD ≤ 91). (K) Graph showing kinetics of cellularization (ingression depth of the furrow over time) in controls (black), bnk−/− (red), Cheerio KD (green), and in bnk−/− Cheerio KD double mutant embryos (purple). While in control embryos, the furrow ingressed ∼22 µm in ∼25 min, in bnk−/− or Cheerio KD embryos, furrow ingression was delayed by a factor of ∼1.5. In bnk−/− Cheerio KD double mutants, the ingression kinetics slowed down even further, resulting in a final ingression depth of not >10 µm. Solid lines indicate the average ingression depth at any given time point, and the semitransparent area indicates the corresponding SD. nControl = 5, nBnk−/− = 4, nCherKD = 8, nBnk−/−&CherKD = 5 embryos. (K–P) Sagittal sections showing myosin-II (grayscale) in a control embryo 10 min (K), 20 min (L), and 30 min (M) after the cellularization furrow reached an ingression depth of 4 µm. Same analysis as in K–M in a bnk−/− Cheerio KD double mutant embryo at 10 min (N), 20 min (O), and 30 min (P). In double mutant embryos, furrow ingression was severely impaired, resulting in short cells without nuclei. Of note, the position of the nuclei was inferred from lack of myosin-II signal and colored in cyan. Scale bars, 10 µm.

