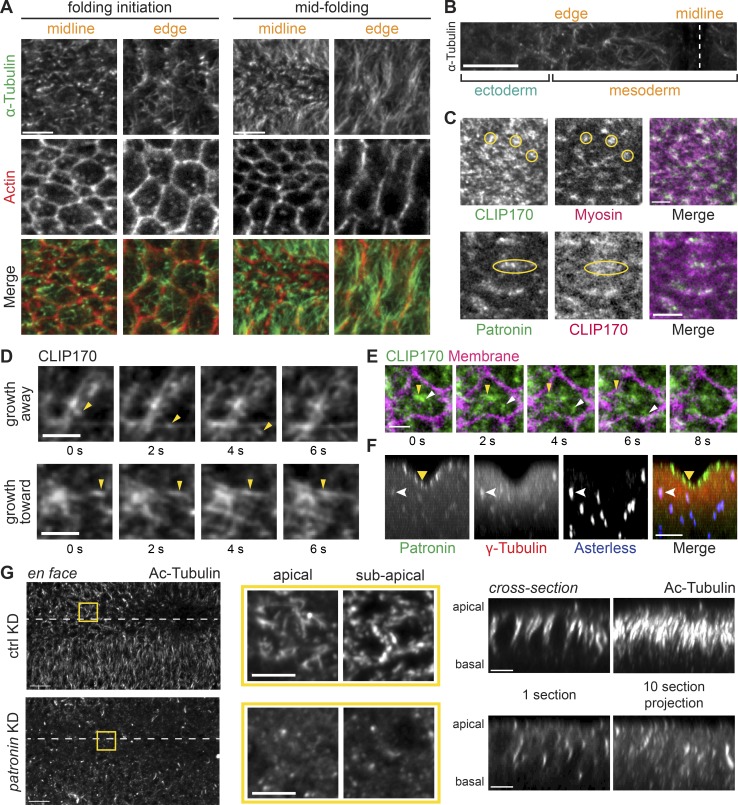
Figure 2.
Patronin stabilizes apical, noncentrosomal microtubules in the mesoderm. (A) In the mesoderm, microtubules are oriented parallel and perpendicular to the apical membrane. Images are maximum-intensity projections from representative fixed embryos stained for α-tubulin (apical surface) and F-actin (subapical section, phalloidin). Surface views of cells along the midline and at the edge of the snail-expressing domain are shown for an embryo at folding initiation and midfolding. (B) Apical microtubules are enriched in mesoderm. Image is an apical surface Z-projection of a fixed embryo stained for α-tubulin. The furrow midline is marked with a dashed white line. (C) GFP::CLIP170 form dense clusters at the apical surface that colocalize with myosin (yellow circles; top) and Patronin (yellow ovals; bottom). Images are single apical sections from a live movie of an embryo expressing GFP::CLIP170 and Myo::mCH (sqh::mCH) or Patronin::GFP and CH::CLIP170. (D) Microtubule growth can be observed with dynamic GFP::CLIP170 comets (yellow arrowheads). Images are montages of single apical slices from representative live movies of embryos expressing GFP::CLIP170. (E) Microtubules grow from an apical microtubule-organizing center toward cell edges. Images are a montage of single apical slices from a live movie of an embryo expressing GFP::CLIP170 and Gap43::mCH. Different GFP::CLIP170 comets are marked with arrowheads. (F) Apical Patronin foci do not colocalize with centrosomal markers. Images are maximum-intensity projections of apical–basal cross sections from a representative fixed embryo stained for γ-tubulin (associated with centrosomes; Dictenberg et al., 1998; red), Asterless (Cep152, a centriolar component; Varmark et al., 2007; Dzhindzhev et al., 2010; blue), and endogenous Patronin::GFP signal (green). Medioapical Patronin (yellow arrowhead) is separate from Patronin::GFP signal at centrosomes (white arrowhead). (G) Depleting Patronin destabilizes microtubules. Images are apical surface projections of representative fixed embryos stained for acetylated-tubulin (Ac-Tubulin). The surface views of rhodopsin-3 control RNAi (top) and patronin-RNAi knockdown (KD; bottom) are shown on the left. The ventral midline is marked by a white dashed line. Middle images are magnified en face views of apical and subapical projections in the yellow box. The right set of images show cross sections of the same embryos on the left. The left image is a single yz section, and the right image is a maximum-intensity projection of 10 cross sections. Scale bars represent 10 µm (B and G, tissue-wide view), 5 µm (A; C, top; F; and G, magnified view and cross section), and 3 µm (C, bottom; and D and E).

