Figure 3.
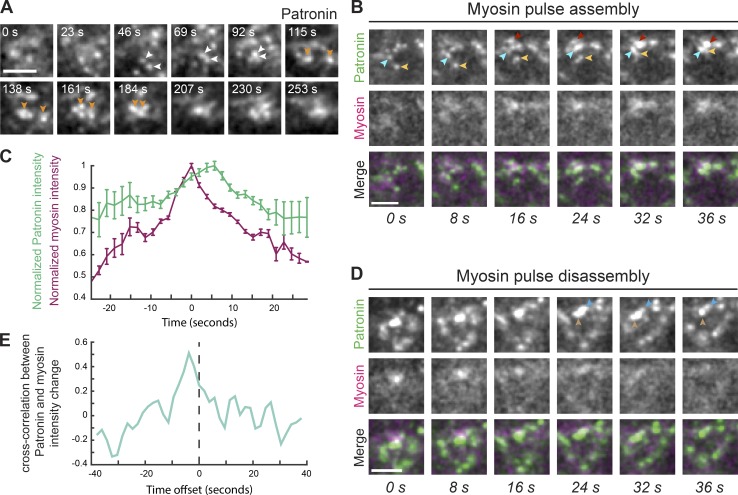
Medioapical Patronin foci form by coalescence during myosin assembly. (A) Patronin foci form by coalescence of smaller puncta (arrowheads). Time-lapse images are from single apical sections from a live movie of a representative embryo expressing Patronin::GFP. (B) Patronin puncta coalescence (arrowheads) occurs during myosin pulse assembly. Time-lapse images represent a myosin pulse (single apical slice) from a live movie of an embryo expressing Patronin::GFP and Myo::mCH. (C) Quantification of average maximum Myo::mCH and Patronin::GFP intensity (n = 4 embryos, 5 pulses per embryo) after normalizing and aligning the maxima of Myo::mCH across all 20 pulses. Time at peak mean myosin intensity was centered at 0. Error bars represent the standard error of the mean. (D) During myosin pulse disassembly, local Patronin::GFP intensity decreases and larger foci revert back to smaller puncta (arrowheads). Time-lapse images are a representative pulse from a single apical section from a live movie of an embryo expressing Patronin::GFP and Myo::mCH. (E) Myosin and Patronin intensity are tightly correlated. Plotted is the mean time-resolved correlation function between changes in Myo::mCH and Patronin::GFP intensity. Maximum correlation occurs at an offset of approximately −4 s. Dashed line indicates time offset of 0 s. Scale bars represent 3 µm.

