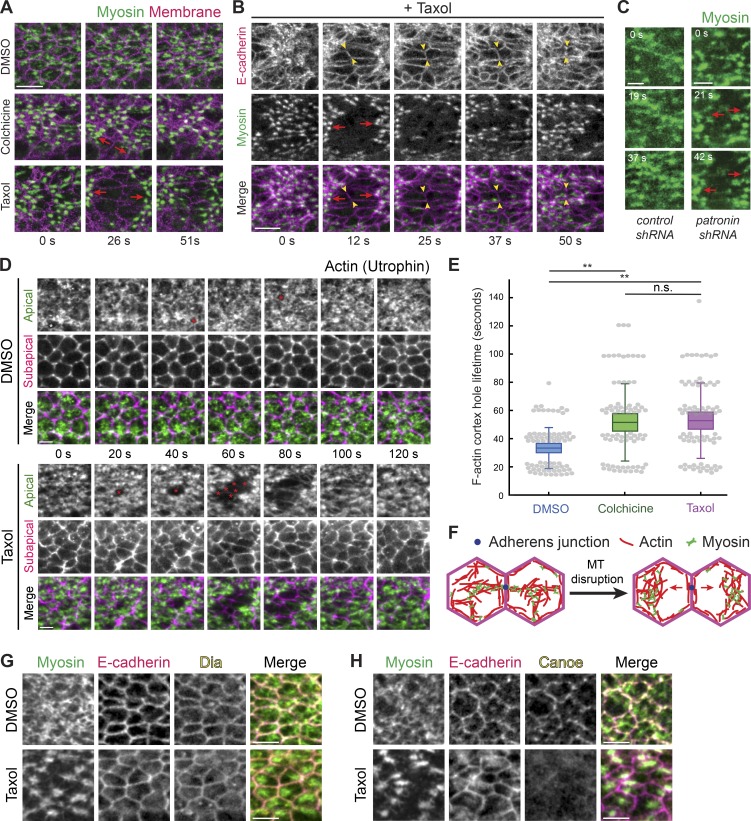
Figure 6.
Microtubules stabilize actomyosin connections to intercellular junctions. (A) Microtubule disruption leads to separations between myosin structures and intercellular junctions. Time-lapse images are maximum-intensity Z-projections from live embryos expressing Myo::GFP (apical surface) and Gap43::mCH (subapical section illustrating junctions) injected with DMSO (top), colchicine (5 mg/ml; middle), and Taxol (5 mg/ml; bottom). Red arrows indicate the direction in which myosin structures separate from cell junctions. (B) E-cadherin is still present at interfaces between myosin spot separations. Time-lapse images are maximum-intensity Z-projections of apical Myo::mCH and an apical Z-slice of E-cadherin::GFP for a representative embryo injected with Taxol (5 mg/ml). Red arrows indicate the direction in which myosin spots separate from cell junctions. One cell–cell interface is highlighted between arrowheads. (C) Depleting Patronin also causes myosin network separation. Time-lapse images are apical projections from representative live embryos expressing Myo::GFP and shRNA against rhodopsin-3 (control, top) and patronin (bottom). Arrows indicate the direction in which myosin spots separate from cell junctions. (D) Taxol injection causes longer-lived and larger holes in the F-actin cortex (asterisks), which leads to separation of F-actin meshworks away from junctions. Time-lapse images are maximum-intensity Z-projections of apical slices (green) and a subapical slice (magenta) from representative live embryos expressing Utr::GFP injected with DMSO or Taxol (5 mg/ml). (E) The lifetime of holes in the F-actin cortex near cell junctions is longer when microtubules are disrupted. Quantification of hole lifetime length at a resolution of ∼20 s between time steps for 75 holes across three embryos in each condition (**, P < 0.0001, unpaired t test). Bottom and top edges of the box are the 25th and 75th percentiles, and whiskers extend to the most extreme data points, excluding outliers. All data points were plotted as gray dots. (F) Diagram showing a model of myosin separation. Shown is a top down view of the apical cortex in two adjacent cells. Loss of attachment of actomyosin to the adherens junction (blue dot) after microtubule (MT) disruption leads to actomyosin network separation. (G) Microtubule disruption does not affect junctional localization of Dia. Images are from representative embryos expressing Myo::GFP that were injected with DMSO (left) or Taxol (5 mg/ml; right), PFA fixed, and immunostained with antibodies against E-cadherin and Dia. (H) Microtubule disruption affects junctional localization of Cno. Images are from representative embryos expressing Myo::GFP that were injected with DMSO (left) or Taxol (5 mg/ml; right), PFA fixed, and immunostained with antibodies against E-cadherin and Cno. Scale bars represent 10 µm (A and B) and 5 µm (C–H).

