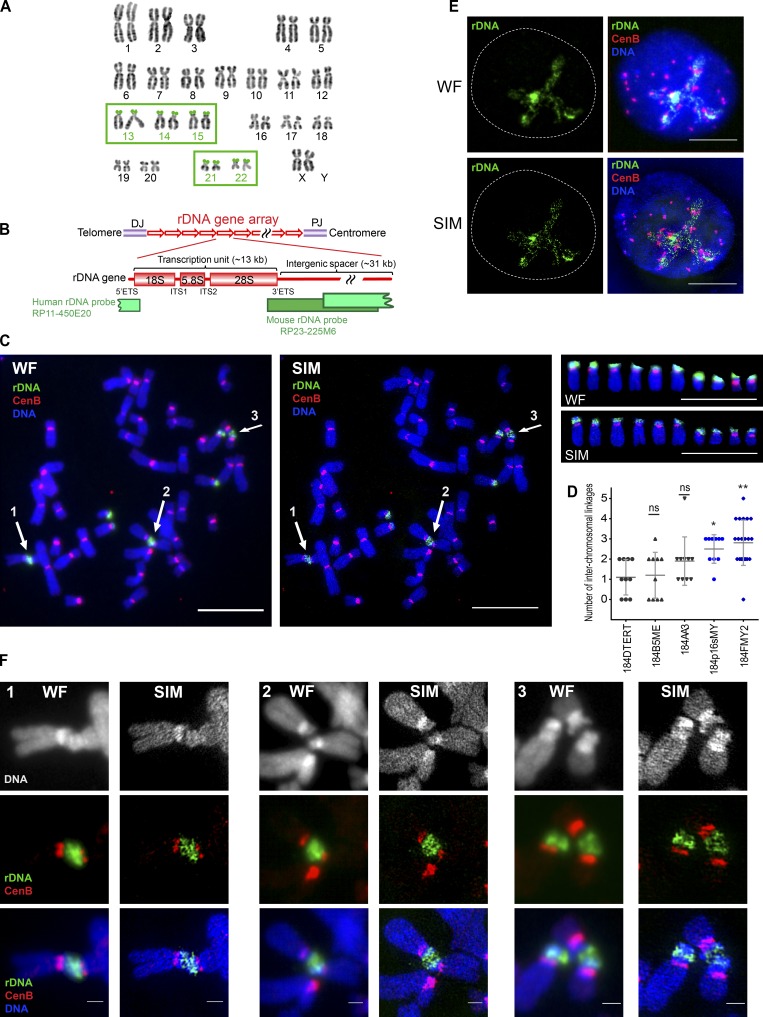
Figure 1.
SIM revealed rDNA linkages between acrocentric human chromosomes. (A) Normal human karyotype with highlighted acrocentric chromosomes 13, 14, 15, 21, and 22 bearing rDNA loci on their short arms, provided courtesy of Karen Miga (Genomics Institute, University of California Santa Cruz, Santa Cruz, CA) and Amalia Dutra (Cytogenetic and Microscopy Core, National Human Genome Research Institute, National Institutes of Health, Bethesda, MD). (B) Schematic representation of rDNA repeat units and coverage of rDNA probes used in this study. In the human karyotype, rDNA genes are arranged as repeats on the short arms of the acrocentric chromosomes between centromeres and telomeres, flanked by proximal and distal junctions (PJ and DJ). Each unit consists of a coding region (encoding pre-mRNA for 18S, 5.8S, and 28S ribosomal RNA subunits) and intergenic spacer. Boundaries of the coding region contain external transcribed spacers (5′ETS and 3′ETS), and coding parts of the 45S sequence are separated by internal transcribed spacers (ITS1 and ITS2). The human rDNA probe used in this study was derived from BAC clone RP11-450E20 and spans the intergenic spacer and the transcription initiation site of the next repeat. The mouse rDNA probe was derived from BAC clone RP23-225M6, spanning the end of the coding part and the intergenic spacer. (C) Wide-field illumination (WF) and SIM images of mitotic chromosome spread from 184FMY2 HMEC cell labeled by FISH with rDNA probe (green) and CenB probe (red). Arrows 1–3 point to acrocentric chromosomal rDNA associations. Panels on the right show individual acrocentric chromosomes: six large rDNA chromosomes and four small rDNA chromosomes. Bar, 10 µm. (D) Quantification of the number of interchromosomal rDNA linkages in chromosomal spreads from isogenic HMEC cell lines labeled by FISH with rDNA probe. Cell lines overexpressing c-Myc highlighted in blue. Images of ≥10 chromosomal spreads from each cell line were examined. The difference between 184DTERT and each of the other cell lines was evaluated using the Mann–Whitney U test. *, P < 0.05; **, P < 0.001; ns, not significant. (E) Wide-field illumination and SIM images of the interphase nucleus of 184FMY2 HMEC cell labeled by FISH with rDNA probe (green) and centromere CenB probe (red). While centromere loci form compact dots, most of the rDNA forms long thin filaments within the nucleolar compartment. Bar, 10 µm. (F) Panels 1–3 show corresponding enlarged wide-field illumination and SIM images of rDNA associations marked by arrows in C. While wide-field illumination images accurately depict rDNA associations, SIM images reveal the network of thin filamentous rDNA linkages between different acrocentric chromosomes. Bar, 1 µm.

