Figure 2.
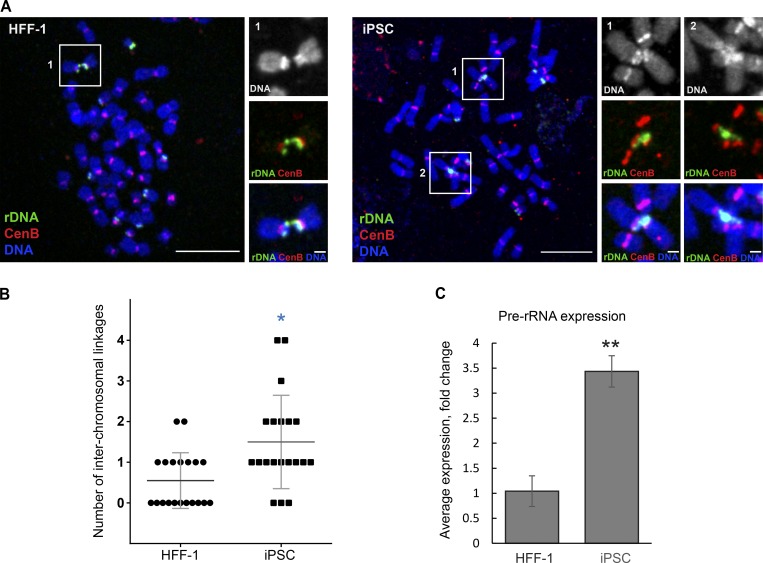
Frequency of rDNA linkages and rRNA synthesis in HFF-1 and derivative iPS cells. (A) Confocal images of mitotic chromosome spread from HFF1 (left) and iPSC (right) cell labeled by FISH with rDNA probe (green) and CenB probe (red). Bar, 10 µm. Magnified insets depict acrocentric chromosomal associations between rDNA (bar, 1 µm). (B) Quantification of the number of interchromosomal rDNA linkages in chromosomal spreads from HFF-1 and iPSC labeled by FISH with rDNA probe. High-resolution confocal images of 20 chromosomal spreads from each cell line were examined. The Mann–Whitney U test was used to compare iPSC with parental HFF-1. *, P < 0.05. (C) Real-time qPCR analysis of iPSC compared with the parental HFF-1 cell line. The expression of pre-rRNA was normalized to the expression of GAPDH mRNA. Bar heights represent an average fold change of three primer sets to the 5′ETS; error bars represent SD. Statistical significance was evaluated using t test; **, P < 0.001.

