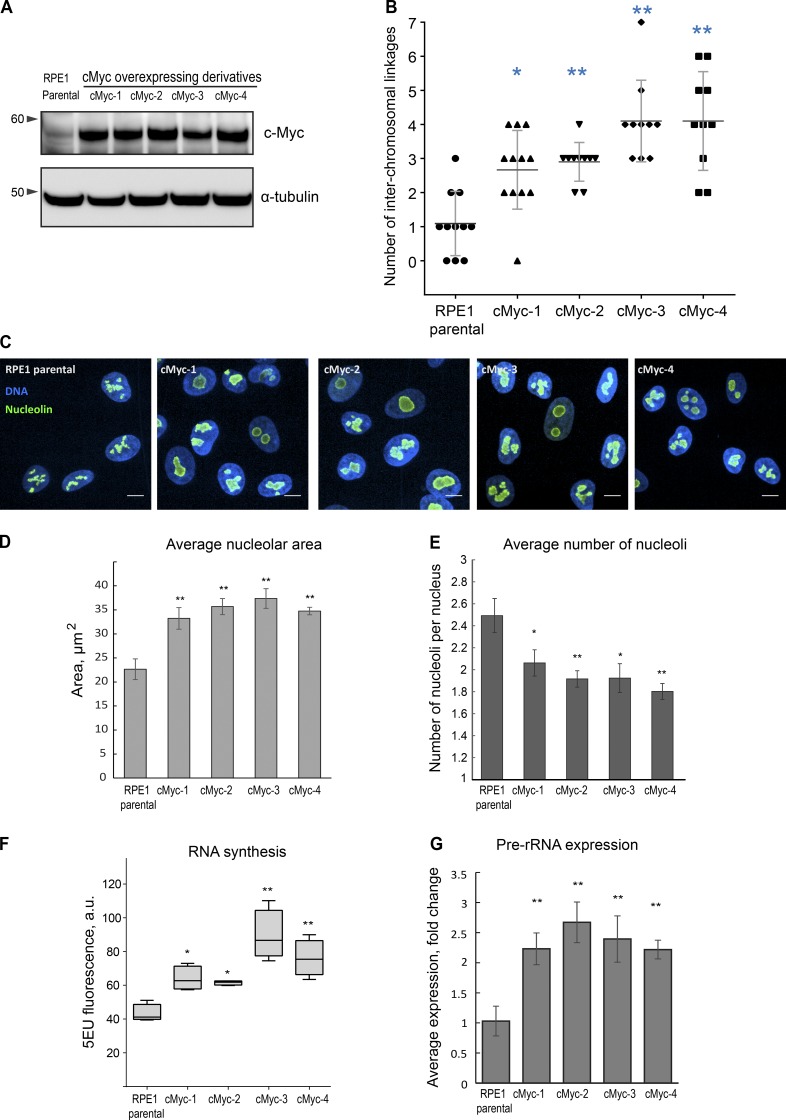
Figure 3.
Overexpression of c-Myc leads to an elevated number of rDNA linkages, increased nucleolar size and merging, and a higher level of rRNA synthesis. (A) Western blot analysis of c-Myc protein levels of parental RPE1 cell line and c-Myc–overexpressing single-cell clone derivatives cMyc-1, cMyc-2, cMyc-3, and cMyc-4. (B) Quantification of the number of interchromosomal rDNA linkages in chromosomal spreads from parental RPE1 cells and c-Myc–overexpressing derivatives labeled by FISH with rDNA probe. High-resolution confocal images of ≥10 chromosomal spreads from each cell line were examined. The Mann–Whitney U test was used to compare c-Myc–overexpressing samples with parental RPE1. *, P < 0.05; **, P < 0.001. (C) Representative spinning disk confocal images of nucleolin immunofluorescence (green) of parental RPE1 cells and c-Myc–overexpressing derivatives. Nuclei were counterstained with DAPI (blue). Note enlarged and merged nucleoli. Bar, 10 µm. (D and E) Quantification of nucleolar area (D) and number (E) based on the nucleolin immunofluorescence labeling as in C show enlargement of the nucleoli and their decreased number in c-Myc–overexpressing cells. Bars show averages of three large fields of view (montage images) containing tens to hundreds of cells. *, P < 0.05; **, P < 0.001. Statistical significance was evaluated using one-way ANOVA with Dunnett multiple comparisons, comparing c-Myc samples to parental control. Error bars denote SD. (F) 5-EU incorporation in parental RPE1 cells and c-Myc–overexpressing single-cell clone derivatives. 5-EU–labeled RNA was detected with fluorescent azide and quantified by high-throughput imaging. Statistical significance was evaluated using one-way ANOVA with Dunnett multiple comparisons. *, P < 0.05; **, P < 0.001. (G) Real-time qPCR analysis of pre-rRNA expression of c-Myc–overexpressing derivatives compared with the parental RPE1 cells. The expression of pre-rRNA was normalized to the expression of GAPDH mRNA. Bar heights represent an average fold change of three primer sets to the 5′ETS; error bars represent SD. Statistical significance was evaluated using t tests; **, P < 0.001.

