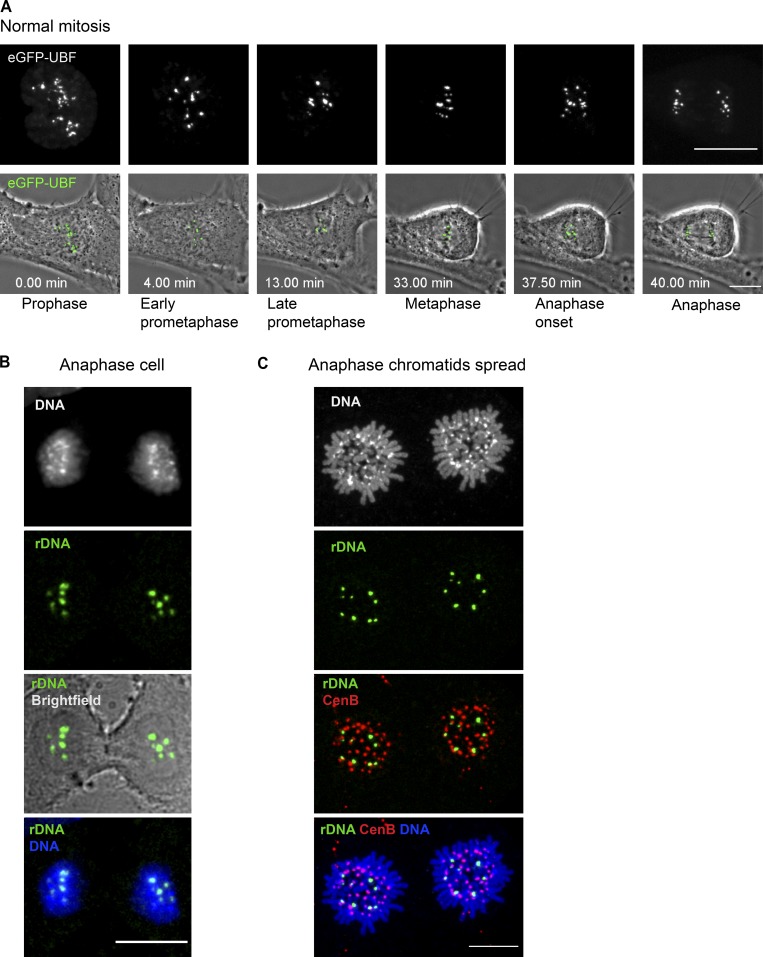
Figure 8.
rDNA linkages resolve at the metaphase-to-anaphase transition. (A) Stills from time-lapse live imaging of the normal mitotic progression in an RPE1 cell expressing GFP-UBF. UBF is localized to rDNA loci that segregate in anaphase as individual dots without connections to oppositely segregating chromatids. The top panels show maximum-intensity projections of spinning disk confocal images of eGFP-UBF, and the bottom panels show maximum-intensity projections of UBF overlaid with the best focal plane phase-contrast images of the cell. The top panels are magnified 1.5× with respect to the bottom panels. Bar, 10 µm. The complete video sequence is shown in Video 1. (B) A normal anaphase RPE1 cell was labeled by FISH with rDNA probe (green). rDNA loci segregate as individual dots. No rDNA-containing chromatin bridges were observed. Bar, 10 µm. (C) A chromatid spread was prepared from an anaphase RPE1 cell and labeled by FISH with rDNA probe (green) and CenB (red). rDNA loci form distinct individual spots that do not appear to be associated with other loci. Bar, 10 µm.

