Figure 9.
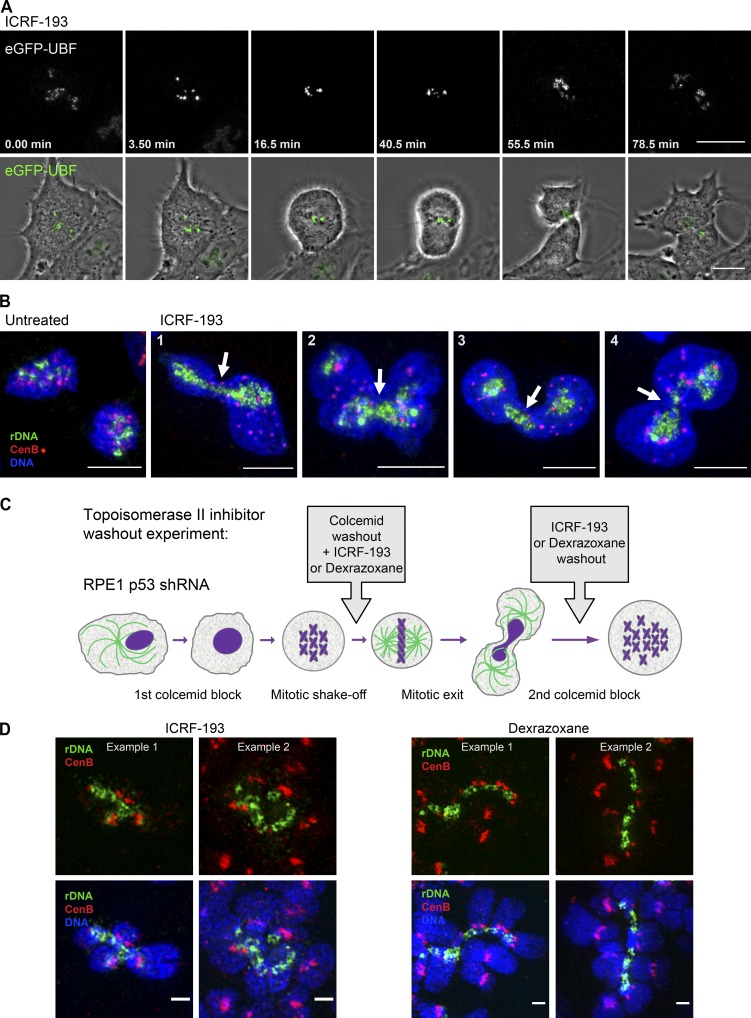
Inhibition of topoisomerase II in mitosis prevents the resolution of rDNA linkages at the metaphase-to-anaphase transition. (A) Time-lapse live imaging of the mitotic progression in RPE1 cells expressing GFP-UBF treated with 5 µM topoisomerase inhibitor ICRF-193. The cell treated with topoisomerase inhibitor shows impaired sister chromatid segregation and fails to segregate rDNA marked by GFP-UBF. The drug was added shortly before the initiation of imaging. The top panel shows maximum-intensity projections of spinning disk confocal images of GFP-UBF, and the bottom panel shows maximum-intensity projections of UBF overlaid with the best focal plane phase-contrast images of the cell. The top panel is magnified 1.5× with respect to the bottom panel. Bar, 10 µm. The complete video sequence is shown in Video 2. (B) Localization of rDNA and centromeres in cells that divided in the presence of topoisomerase inhibitor ICRF-193. Asynchronously growing c-Myc–overexpressing RPE1 derivative cell line cMyc 3 was untreated (first left panel) or treated with 5 µM ICRF-193 for 30 min (right panels). Cells were fixed and labeled by FISH with rDNA probe (green) and CenB probe (red). DNA was counterstained with DAPI. Maximum-intensity projections of confocal images depict cells that failed to segregate the rDNA. Four examples of individual cells are shown (1–4). Arrows point to rDNA trapped in the cleavage furrow. Bar, 10 µm. (C) A schematic of the experimental design of topoisomerase II washout experiment is shown. RPE1 cells stably expressing p53 shRNA were arrested in mitosis by colcemid for 10 h and collected by mitotic shake-off. Colcemid was removed, and 10 µM ICRF-193, 500 µM dexrazoxane, or control vehicle (DMSO) were added to the mitotic cells. Cells were allowed to rebuild the mitotic spindle, exit mitosis, and attach to the plates for 4 h. After this, topoisomerase inhibitors were washed out, and cells were allowed to progress through the cell cycle for another 14–15 h. Therefore, cells were treated with topoisomerase II inhibitors during mitotic exit only. Then, colcemid was added again for 10 h to collect cells in the next mitosis for chromosomal spreads. (D) Cells that exited mitosis in the presence of topoisomerase II inhibitors display complex rDNA linkages. Mitotic spreads prepared from cells in C were labeled by FISH with rDNA probe (green) and CenB probe (red) and imaged by SIM. Fragments of spreads containing complex multichromosomal linkages are shown. Two examples are shown per drug treatment. Bar, 1 µm.

