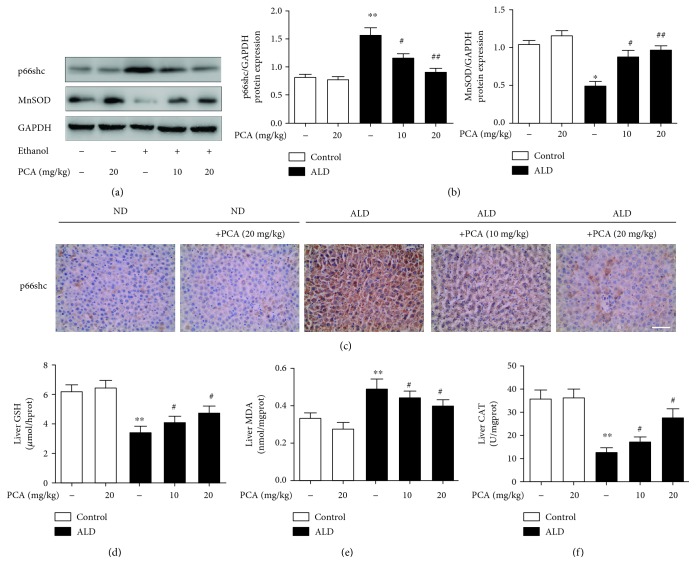
Figure 2.
PCA reduced p66shc-mediated ROS formation in rat livers. (a, b) Protein levels of p66shc and MnSOD in rat livers (n = 3); (c) immunohistochemistry analysis of p66shc in different groups of rats. Scale bar = 100 μm. (d) Hepatic GSH levels (n = 10), (e) hepatic MDA levels (n = 10), and (f) hepatic CAT levels (n = 10). ∗∗ P < 0.01 and ∗ P < 0.05 compared with ND; ## P < 0.01 and # P < 0.05 compared with ALD.

