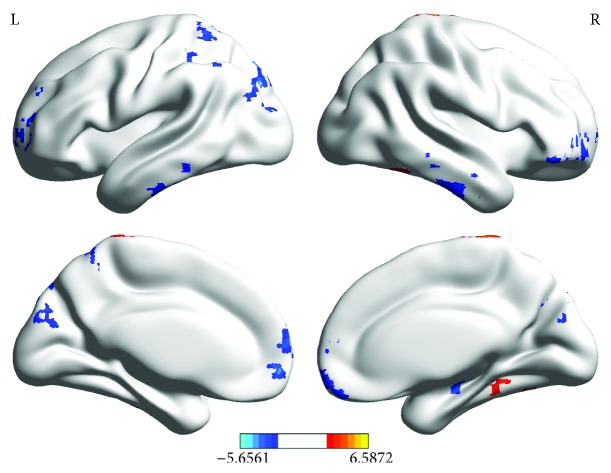
Figure 1.
Differences in ALFF between the amblyopia group and HCs (P ≤ 0.05, alphasim corrected, and cluster size > 85). The red region indicates that the ALFF of the amblyopia group is significantly higher than that of HCs. The blue region implies that the ALFF of the amblyopia group is significantly lower than that of HCs.

