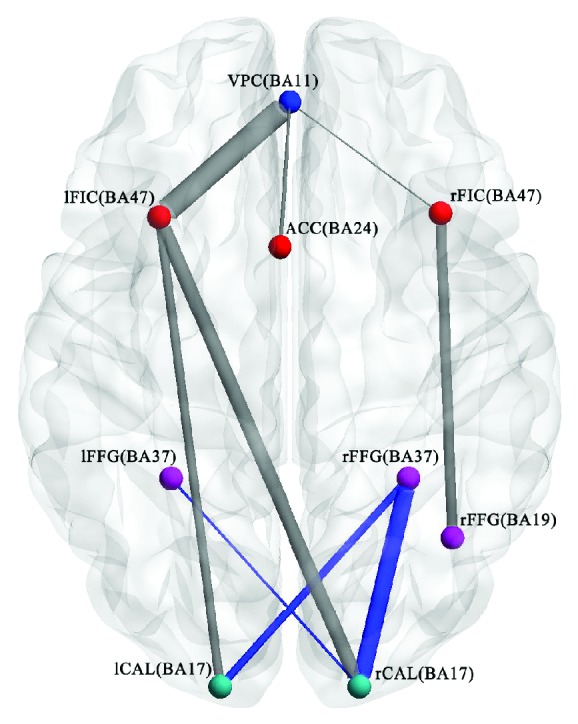
Figure 3.

Differences in the FC of ROIs between the amblyopia group and HCs (P ≤ 0.05, FDR corrected, and cluster size > 85). Blue indicates that the FC strength in the amblyopia group is enhanced compared with that in HCs. Gray implies that the FC strength in the amblyopia group is weakened compared with that in HCs. VPC: ventromedial prefrontal cortex; lFIC: left frontoinsular cortex; rFIC: right frontoinsular cortex; ACC: anterior cingulate cortex; lFFG: left fusiform gyrus; rFFG: right fusiform gyrus; lCAL: left calcarine cortex; rCAL: right calcarine cortex.
