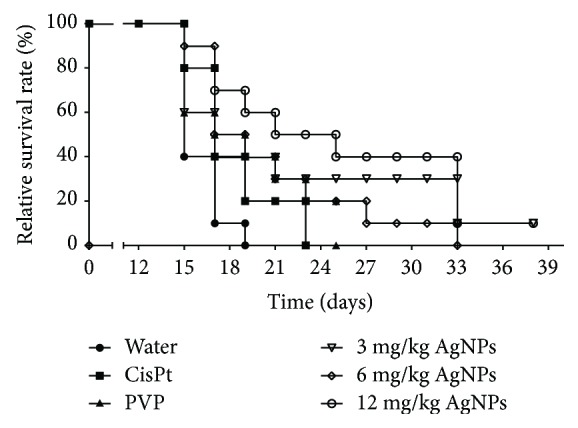
Figure 4.

Kaplan-Meier plot showing the relative survival rates of mice treated with AgNPs or CisPt. Mice without melanoma and without treatment were used as negative controls (healthy mice, 100% survival rate). Mice with melanoma and injected with water (water), 2 mg/kg of Cisplatin (CisPt), 12 mg/kg of PVP (PVP), and 3, 6, or 12 mg/kg of AgNPs are identified at the bottom of the figure. ∗ and Φ indicate a statistically significant difference of P < 0.05 comparing groups treated with AgNPs with groups treated with water and CisPt, respectively.
