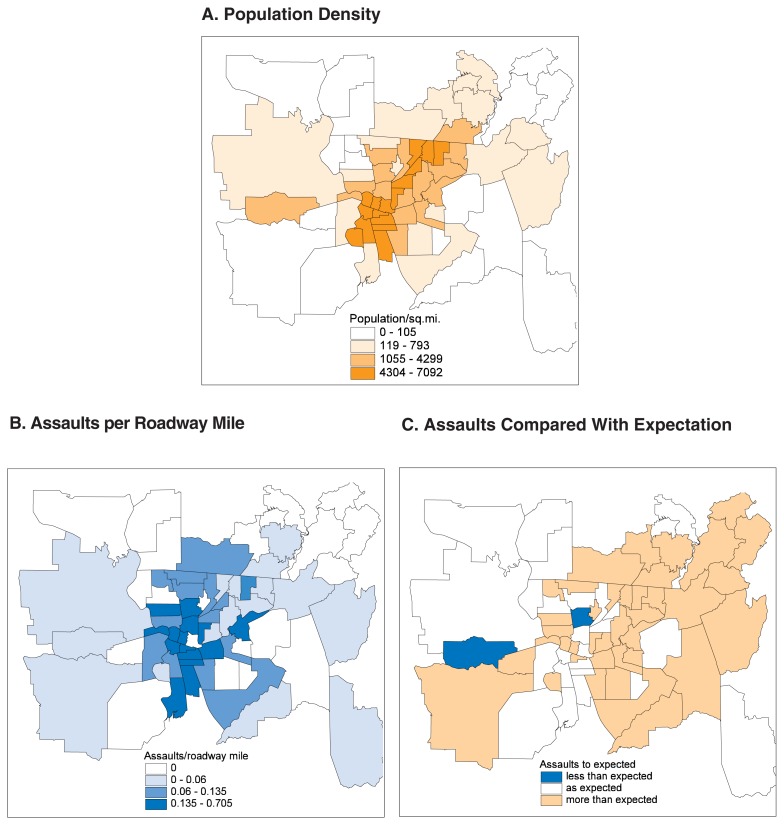
Figure 3.
Illustration of the use of geographic information system-based maps with spatial statistics. The geographic distribution of assaults within areas of communities is clearly related to neighborhood populations. Geographic distributions of assaults are, however, also related to characteristics of places and populations living outside of neighborhoods. Taking this spatial information into account, the distribution of hot spots for violence can be better revealed (figure 3c).
NOTE: Figure 3c map is based on a model designed to predict assaults based on population density and assaults per roadway mile. “Hot spots,” in orange indicate places where there are more assaults than expected. “Cold spots,” in blue, indicate places where there are fewer assaults than expected.

