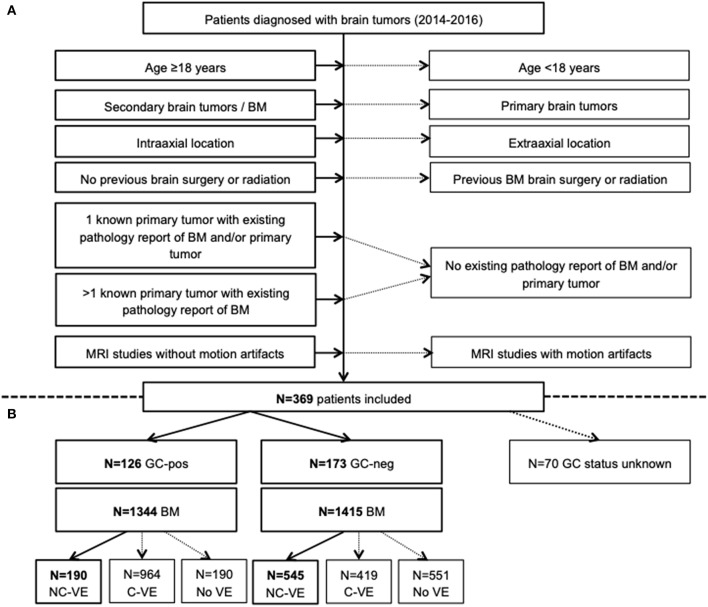
Figure 1.
Flow-chart summarizing patient selection in the study (A) and distribution of patients who received GC (GC-pos) and who did not (GC-neg) with corresponding number of brain metastases (BM) and edema (VE, B). Only VE without connection to an adjacent VE (NC-VE) were segmented and included in final analysis (thick boxes). BM, brain metastases; C-VE, confluent vasogenic edema; GC-neg, patient did not receive glucocorticoids; GC-pos, patient received glucocorticoids; MRI, magnetic resonance imaging; NC-VE, non-confluent vasogenic edema; y, years.

