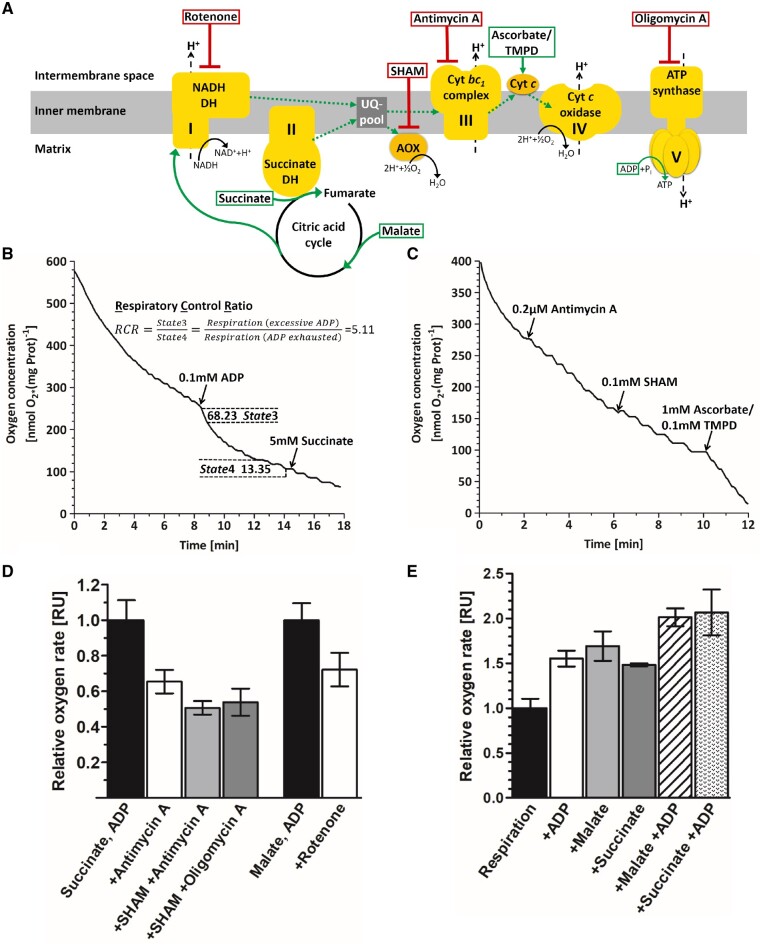
Fig. 5.
Analysis of mitochondrial respiration by Clark electrode measurements. (A) Schematic representation of the mitochondrial respiratory chain and phosphorylation complexes (yellow). The direction of the electron flow (dotted green arrows) is stimulated by different substrates (green boxes). Application of inhibitors at the corresponding site of action are indicated by red boxes. Complex I, NADH dehydrogenase; complex II, succinate dehydrogenase; complex III, cytochrome bc1 reductase; complex IV, cytochrome c reductase; complex V, ATP synthase; UQ-pool, ubiquinone pool; AOX, alternative oxidases; cyt c, cytochrome c. (B, C) Exemplary oxygen measurements. Mitochondrial respiration (solid line) is plotted as time-resolved oxygen consumption and was measured in complete darkness. (B) Addition of ADP (first arrow) uncouples phosphorylation from the mitochondrial respiratory chain, resulting in increased oxygen consumption. Reintroduction of the substrate succinate (second arrow) did not increase respiration rates, illustrating that substrates were not limited during the measurement. The respiratory control ratio (RCR = 5.11) shows tight coupling of respiration to phosphorylation. State3 (active respiration), maximum speed of respiration when both substrate and ADP are available in excess. State4 (ADP-limiting state), speed of the respiratory chain when substrate is available, but all ADP has been phosphorylated. (C) Inhibition of complex III by Antimycin A only becomes evident when Alternative oxidases (AOX) are inhibited similarly. Ascorbate and TMPD bypasses the inhibition leading to increased oxygen depletion. (D) Examination of mitochondrial respiration upon application of different inhibitors. Mitochondrial respiration was saturated with substrate (succinate or malate) and ADP before different inhibitors were applied. Data represent the means of at least two replicates � SEM. (E) Relative effects of substrates on the respiration rates normalized to endogenous respiration, data represent the means of at least two replicates � SEM.

