Fig. 6.
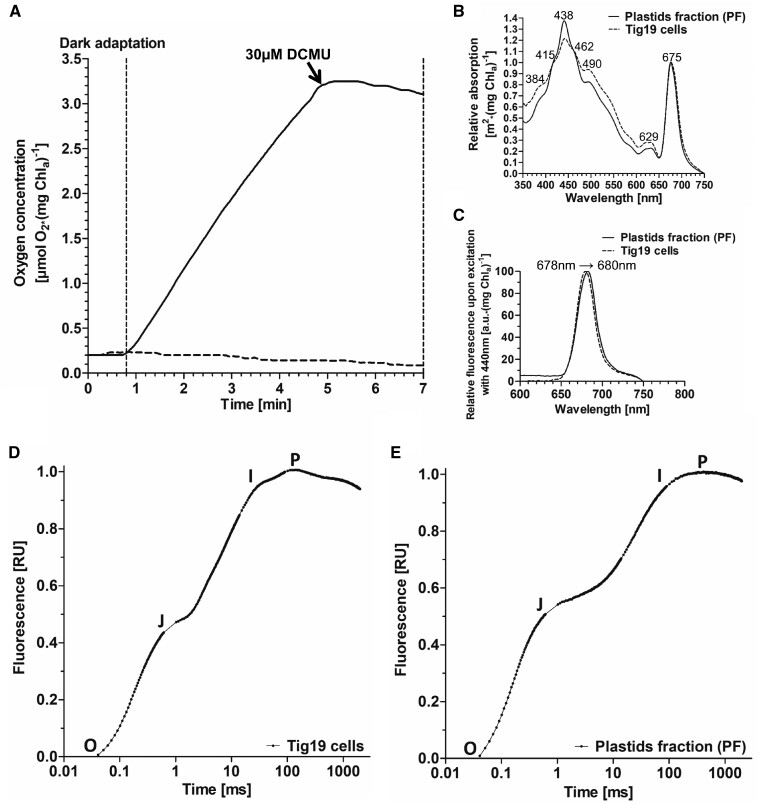
Oxygen evolution, absorption, fluorescence emission spectra and O-J-I-P fluorescence transients of isolated plastids and cells. (A) Oxygen evolution of plastids preparations. Prior to every measurement, isolated plastids were adapted to the dark for 2 min. Thirty-five micrograms of isolated plastids (corresponding to chlorophyll a) were illuminated with 200 �E m−2 s−1 in the presence of 40 mM potassium ferricyanide (solid line). DCMU treatment blocked the plastoquinone binding pocket QB which immediately abolished oxygen production. Dark control (dashed line). (B) Absorption spectrum of Tig19 cells (dashed line) compared to plastids fraction (PF; solid line). (C) Fluorescence emission spectrum of Tig19 cells (dashed line) compared to plastids fraction (PF; solid line). (D, E) O-J-I-P fluorescence transients of T. pseudonana cells and plastids fraction (PF). Untreated Tig19 cells or plastids corresponding to 1 �g/ml chlorophyll a were adapted to the dark for 10 min prior to measurements. Curves were double normalized between O and P [VOP = (FT−Fo)/Fm−Fo)] and plotted on a logarithmic scale.

