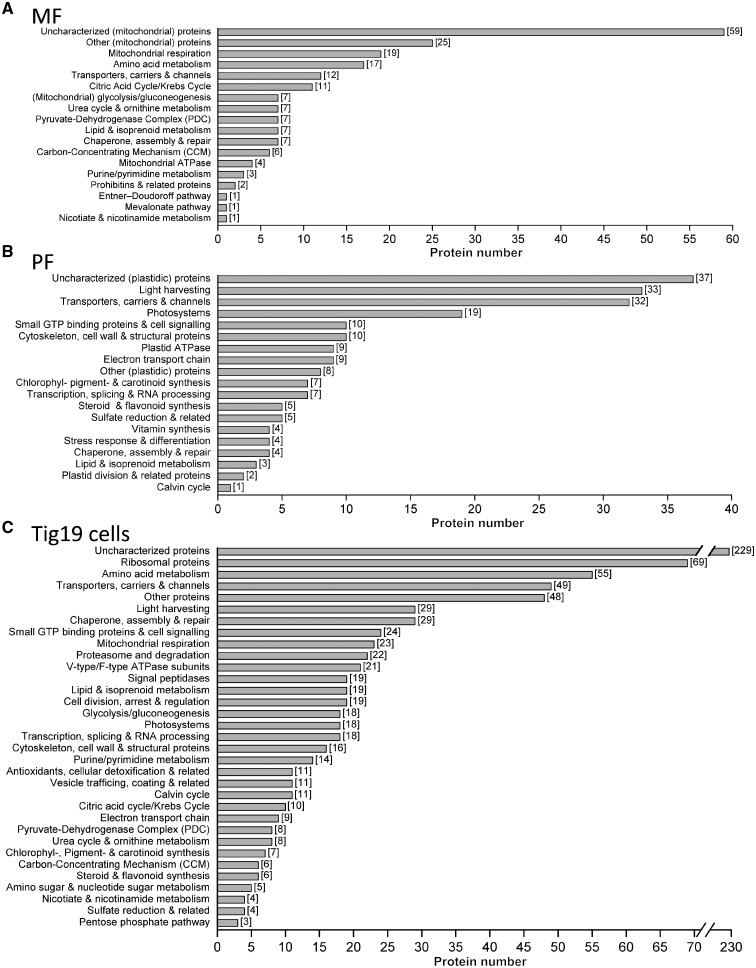
Fig. 7.
Mass Spectrometry profile of proteins within mitochondria (MF), plastids (PF) and Tig19 cells categorized in functional groups. All proteins detected within the MF (325), PF (217) and Tig19 cells (842) were annotated according to the workflow described in the Materials and Methods section and in Supplementary Fig. S5. All proteins annotated this way were manually compiled in functional groups by following the T. pseudonana KEGG pathways reference maps (three-letter code: tps) and database annotations. Bar charts of the MF (A) and PF (B) do not include proteins that were assigned as ‘cellular contaminants’ (MF: 129 proteins; PF: 8 proteins; refer Supplementary Tables S1 and S2). Bar charts of Tig19 cells (C) represent all evident proteins detected.

