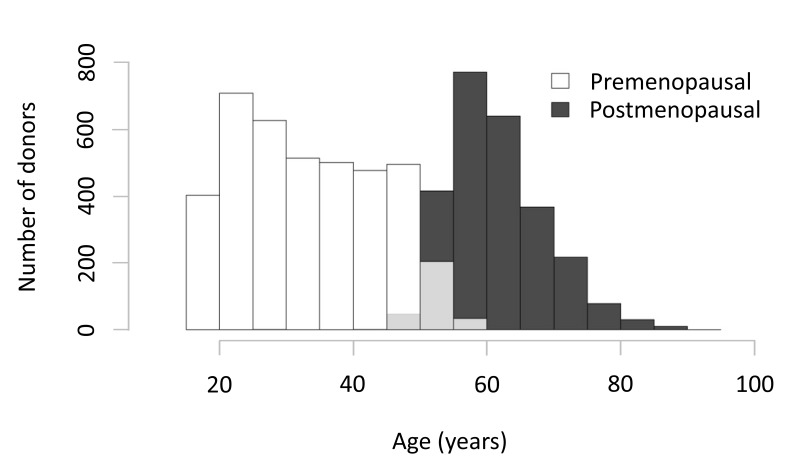
Figure 1.
Distribution of donor menstrual status by age of the donors in the RBC-Omics study.
Bar graphs represent the numbers of pre- and postmenopausal female donors at each decade. Menstrual status was self-reported by female donors at the time of recruitment into the RBC-Omics study, as detailed in the “Materials and methods” section. Of the 6,636 female donors, 3,966 were defined as premenopausal and 2,583 as postmenopausal. Partial grey bars represent overlap between pre- and postmenopausal women at specific age groups.

