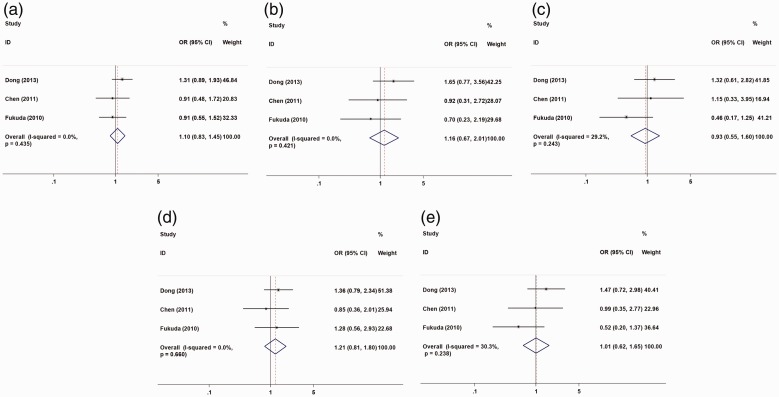
Figure 4.
Forest plot of hepatocellular cancer risk associated with rs1045642 (C>T) models. (a) allele model; (b) homozygous model; (c) heterozygous model; (d) recessive model; (e) dominant model. The horizontal line indicates the lower and upper limits of the 95% CI; the square indicates the OR, with the size of the square indicating the weight of the study and the dotted red line indicating the combined OR value. The diamond represents the combined effect size, and the larger the diamond, the larger the confidence interval. A cross between the diamond and the ineffective line indicates no statistical correlation between the factors studied and the outcome; if the diamond falls on the left side of the invalid vertical line, it indicates a protective factor; if the diamond falls on the right side of the line, it indicates a risk factor. OR, odds ratio; CI, confidence interval.

