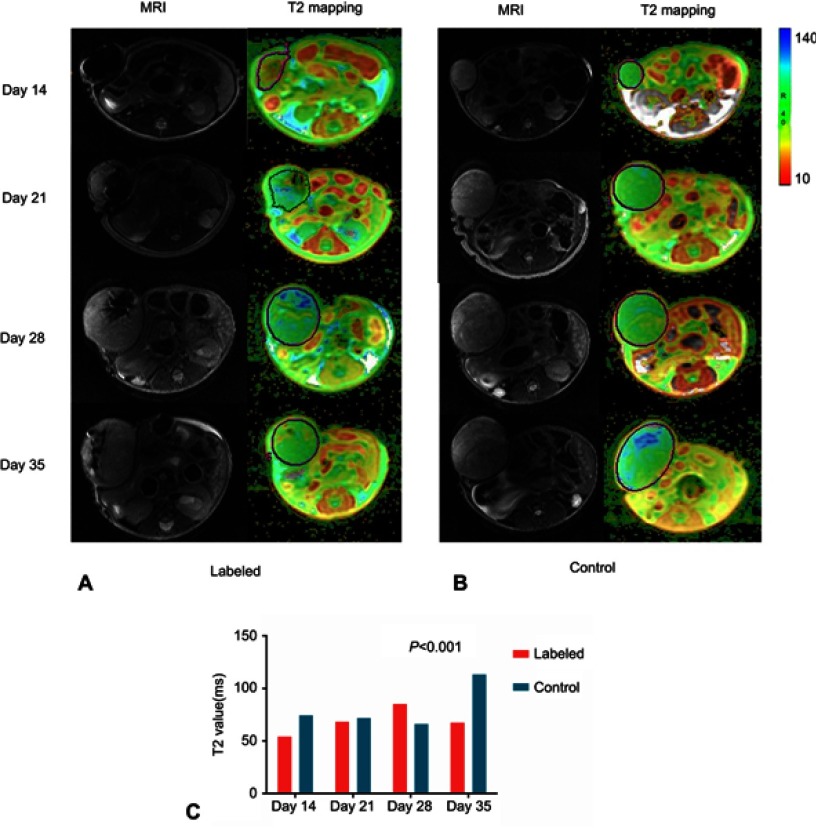
Figure 4.
Appearance of labeled and unlabeled tumors over time and the corresponding T2 mapping colour images. (A, B) Conventional T2 images and pseudocolor images derived from T2 mapping images from mice at days 14, 21, 28, and 35 postinjection with labeled cells compared with images from the corresponding control groups. (C) The T2 values were compared over time between the labeled group and control group after injection of tumor cells (P<0.001).

