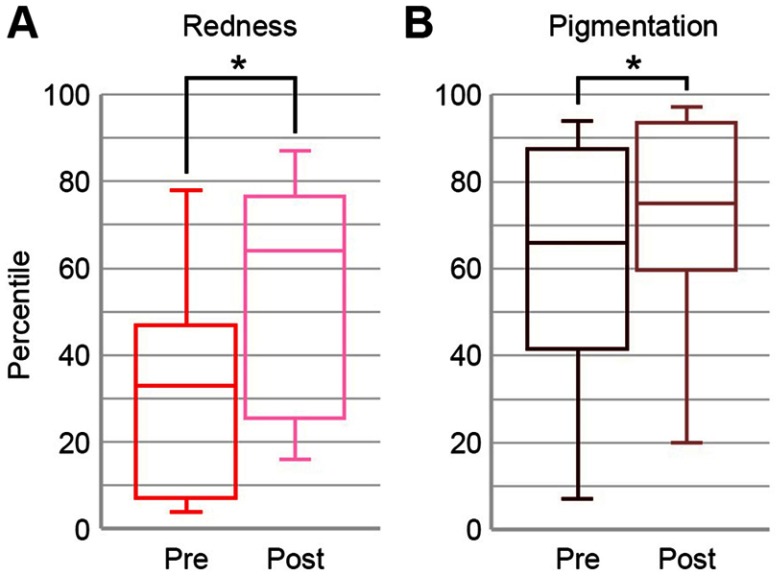
Figure 6.
Objective computer assessments in redness (A) and pigmentation (B) showed significant improvement compared with pre-treatment (P=0.0021 and 0.0022, respectively). The box illustrates the interquartile range extending from the 25th percentile to the 75th percentile with a line at the median (50th percentile). The bottom and top end of whiskers show the minimum and maximum data points, respectively. Significant differences compared with pre-treatment are indicated (*P<0.05).

