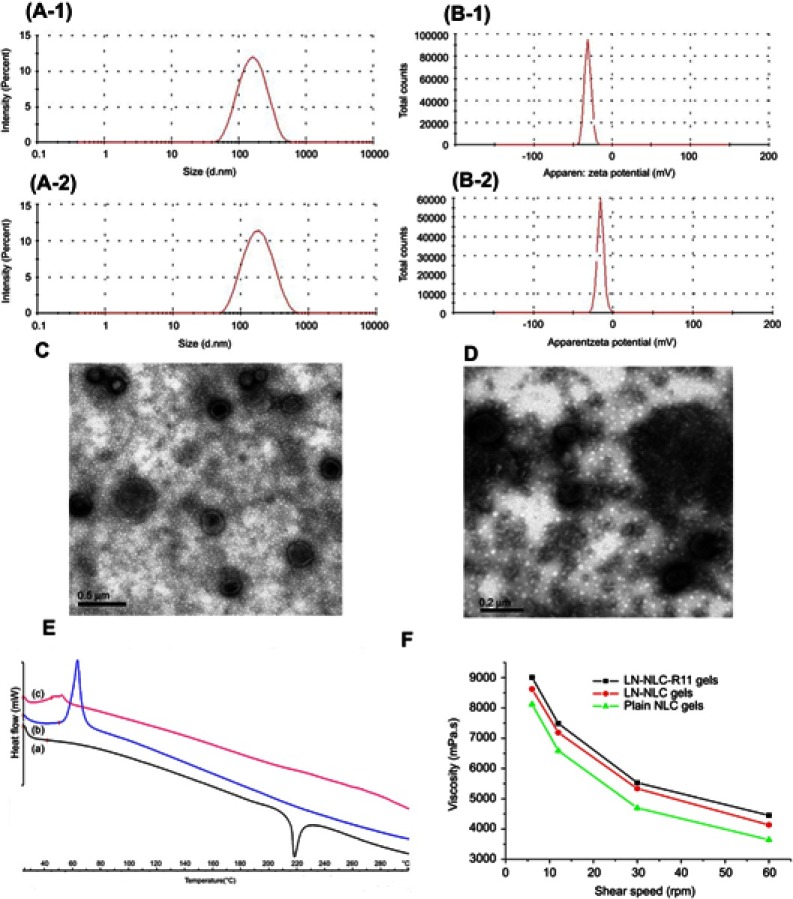
Figure 1.
Pharmaceutical characterization of nanoparticles and gels.
Notes: (A-1), (A-2) Size distribution of LN-NLC and LN-NLC-R11, respectively; (B-1), (B-2) Zeta potential distribution of LN-NLC and LN-NLC-R11, respectively; (C and D) TEM imagines of LN-NLC-R11 and NLC-R11; (E) DSC thermograms of LN (A), glyceryl monostearate (B) and LN-NLC (C); (F) Flow curves of formulation gels. Data presented as mean ± SD (n=3).

