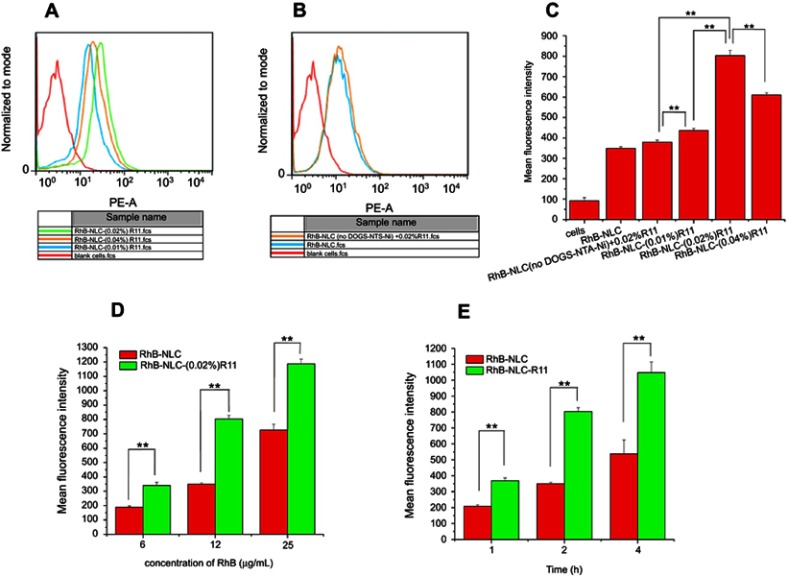
Figure 3.
Cell uptake of different formulations in HaCaT cells analyzed by flow cytometry.
Notes: Flow-cytometry analysis (A and B) mean fluorescence intensities (C) of different formulations in HaCaT cells. (D and E) Mean fluorescence intensities of RhB-NLC and RhB-NLC-(0.02%) R11 incubated with HaCaT cells in various concentrations and time. **P<0.01. Data presented as mean ± SD (n=3).

