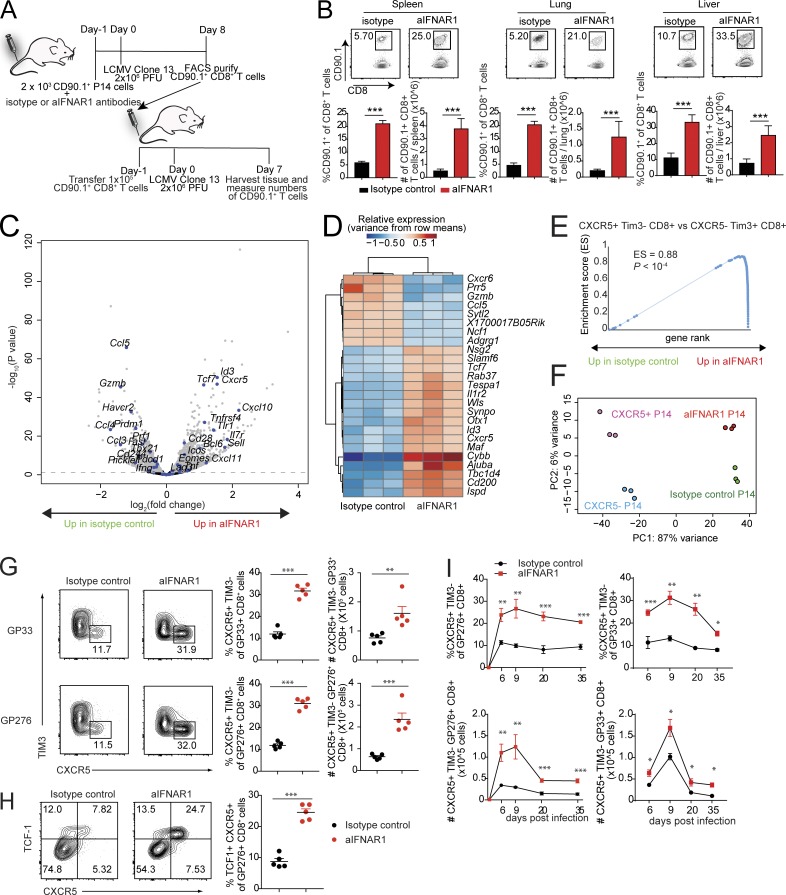
Figure 1.
Blockade of IFN-I promotes the expansion of virus-specific CXCR5+ TIM3− CD8+ T cells. (A and B) Experimental scheme for adoptive transfer experiments. C57BL/6J host mice received 2 × 10³ CD90.1+ P14 cells and isotype control or aIFNAR1 antibodies 1 d before infection with Cl13 (2 × 10⁶ focus-forming units). At 8 dpi, 105 P14 cells were sorted from these mice and then adoptively transferred into another two groups of CD90.2+ mice, followed by LCMV Cl13 infection the next day. P14 cells in spleen, lung, and liver of the recipient mice were quantified at 7 dpi. (C–F) P14 cells were transferred into isotype- or aIFNAR1-treated mice, followed by LCMV Cl13 infection the next day. P14 cells were then sorted at day 10 after infection and subjected to RNA-seq analysis. (C) Volcano plot showing statistical significance (P value) versus fold increase of gene expression comparing aIFNAR1-treated P14 cells to isotype-treated control. Left half: Down-regulated with aIFNAR1 treatment. Right half: Up-regulated with aIFNAR1 treatment. Genes with important function in T cells are highlighted. (D) Heat map of hierarchically clustered top differentially expressed genes (by P value) between isotype- and aIFNAR1-treated mice. (E) GSEA demonstrating a significant enrichment of CXCR5+ CD8+ T cell gene signature within P14 of the aIFNAR1-treated group but not the isotype-treated controls. The CXCR5+ CD8+ T cell gene set was constructed from a publicly available dataset (GEO accession no. GSE84105) by taking the top 100 genes most significantly up-regulated in CXCR5+ Tim3− CD8+ cells versus CXCR5− Tim3+ CD8+ T cells. (F) Principal component analysis of transcriptomes of purified CXCR5+ and CXCR5− P14 cells using reanalyzed RNA-seq reads from Leong et al. (2016) and P14 cells from mice treated with isotype control or aIFNAR1 antibody. (G–I) Isotype- or aIFNAR1-treated mice were infected with LCMV Cl13, and endogenous virus-specific CXCR5+ CD8+ T cells were analyzed. (G) Frequency and total number of DbGP33+ and DbGP276+ CXCR5+ CD8+ T cells in the spleens of isotype- or aIFNAR1-treated mice at 9 dpi. (H) Frequency and total number of DbGP276+ TCF1+ CXCR5+ cells in the spleens of isotype- or aIFNAR1-treated mice at 9 dpi. (I) Frequency and total number of DbGP276+ CXCR5+ CD8+ T cells in the spleen of isotype- or aIFNAR1-treated, Cl13-infected mice at different time points after infection. For panels A, B, G, and H, data show n = 5 mice per group and are representative of two independent experiments. Numbers on flow plots indicate the frequency of each gated population. In G and H, axes indicate log10 fluorescence. Statistical analyses of differential expression and gene set enrichment were performed using DESeq2 and GSEA, respectively; statistical comparison of experimental groups in B, G, and I were performed using Student’s two-tailed t test; bars represent mean ± SEM. *, P < 0.05; **, P < 0.01; ***, P < 0.001. See also Fig. S1.

