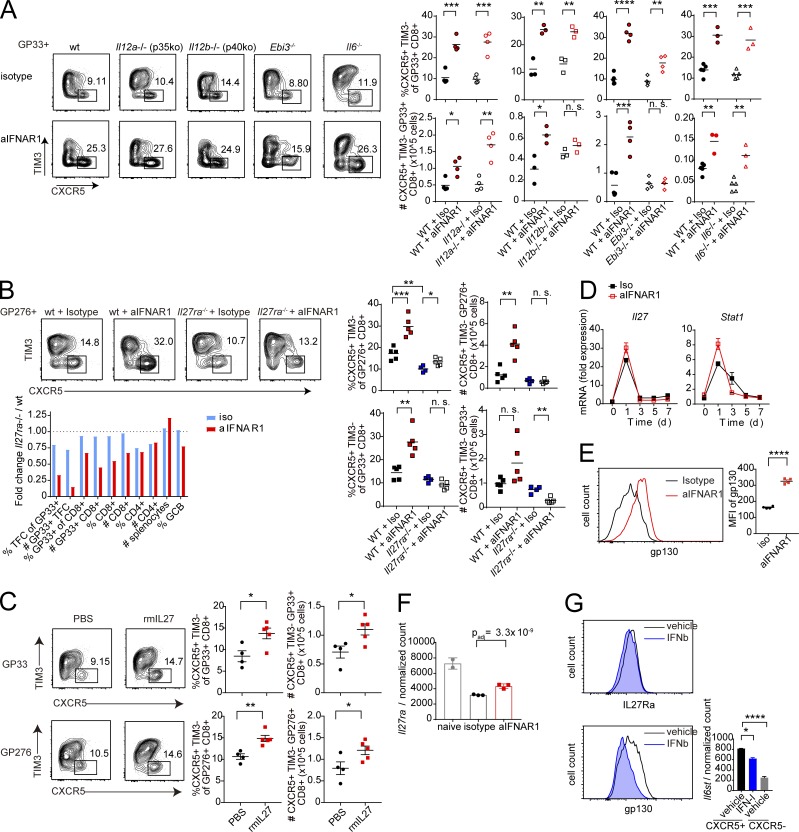
Figure 3.
IL-27 and IL-27R drive CXCR5+ CD8+ T cell expansion following IFNAR1 blockade. (A) Percentages and total numbers of GP33-41–specific CXCR5+ TIM3− follicular cytotoxic CD8+ T cells in WT and congenic IL-12 p35-deficient (Il12a−/−), IL-12 p40-deficient (Il12b−/−), IL-27 EBI3-deficient (Ebi3−/−), and IL-6–deficient (Il6−/− mice treated with IgG1 isotype control or aIFNAR1 antibodies and infected with Cl13. Splenic CXCR5+ CD8+ T cells were analyzed at 9 dpi. (B) Percentages and total numbers of virus-specific CXCR5+ TIM3− follicular cytotoxic CD8+ T cells in WT and congenic IL-27R–deficient (Il27ra−/−) mice treated with IgG1 isotype control or aIFNAR1 antibodies and infected with Cl13. Splenic CXCR5+ CD8+ T cells were analyzed at 9 dpi. Bottom: Ratio of individual splenocyte populations in IL-27R–deficient versus WT mice treated with isotype or aIFNAR1. (C) Percentages and total numbers of virus-specific CXCR5+ TIM3− CD8+ T cells in WT mice that were treated with recombinant IL-27 protein on days 0–8 of Cl13 infection by intraperitoneal injection; data shown for 9 dpi. (D) Dynamics of mRNA expression of IL-27 p28 (Il27) and Stat1 in splenocytes from mice treated with aIFNAR1 or isotype control through 0–7 dpi with Cl13. (E) Expression of GP130 protein on P14 cells from aIFNAR1- or isotype-treated mice infected with Cl13, measured by MFI. (F) Normalized mRNA expression of IL-27R (Il27ra) on virus-specific P14 cells from naive mice or mice treated with isotype or aIFNAR1 and infected with Cl13. Bars represent mean ± SD. (G) Level of IL-27R subunits IL-27RA and GP130 on virus-specific CD8+ T cells treated with IFNβ or vehicle. Right: mRNA level of Il6st (encoding GP130) on WT CXCR5+ CD8+ T cells from Cl13-infected mice treated with vehicle or IFN-I and vehicle-treated CXCR5− CD8+ T cells. Numbers on flow plots (A–C) indicate the frequency of each gated population; axes in A–C and horizontal axes in E and G indicate log10 fluorescence. Experiments were performed with three to five mice per group, and data are representative of three independent experiments. Statistical comparisons of experimental groups were performed using Student’s two-tailed t test: not significant (n.s.), P > 0.05; *, P < 0.05; **, P < 0.005; ***, P < 0.0005; ****, P < 0.0001. rmIL27, recombinant mouse IL-27 protein; wt, wild type. See also Fig. S3.

