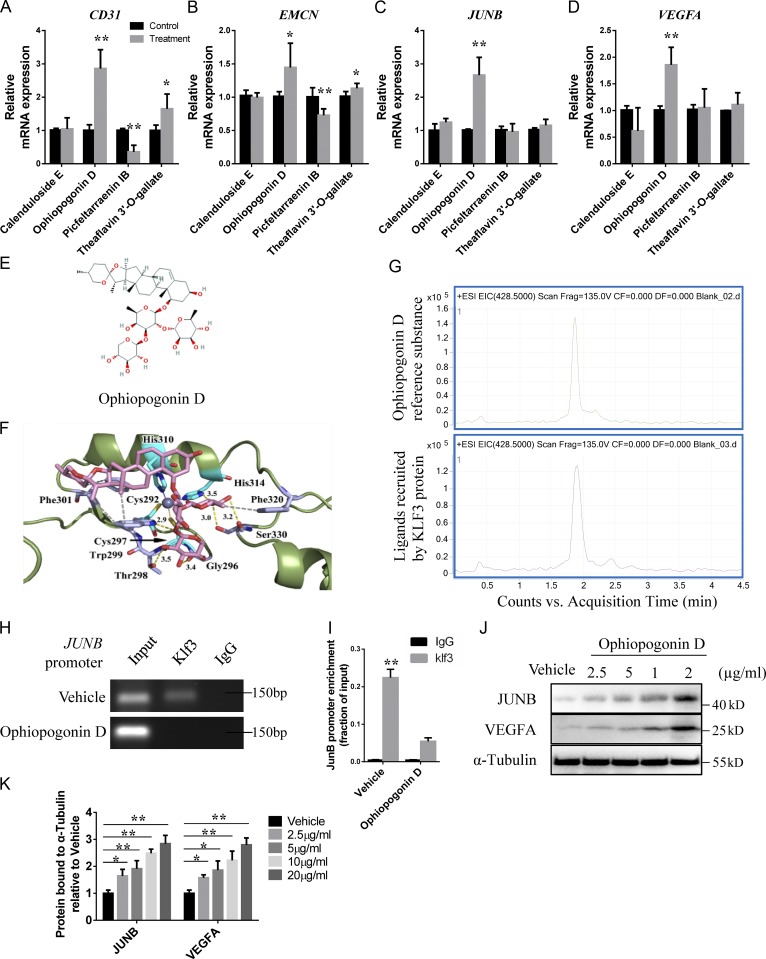
Figure 7.
A natural compound is identified as a KLF3 inhibitor by molecular docking. (A–D) qRT-PCR analysis of the relative levels of CD31 (A), EMCN (B), JUNB (C), and VEGFA (D) expression in HMECs treated with four different compounds. n = 3 in each group from three independent experiments. (E) The structure of Ophiopogonin D selected by molecular docking. (F) Crystal structure of Ophiopogonin D bound to Klf3. (G) HPLC-MS chromatograms of Ophiopogonin D reference substance (upper panel) and KLF3 recruit ligand (lower panel). Representative of two independent experiments. (H) ChIP-PCR assays with anti-Klf3 antibodies or anti-IgG antibodies in HMECs treated with Ophiopogonin D and control groups. Representative of three independent experiments. (I) qRT-PCR analysis of JUNB expression after anti-KLF3 or anti-IgG ChIP. n = 3 in each group from three independent experiments. (J and K) Western blotting analysis (J) and the quantification (K) of the levels of JUNB and VEGFA in HMECs treated with vehicle or different doses of Ophiopogonin D. Representative of three independent experiments. Data are shown as the mean ± SD. *, P < 0.05; **, P < 0.01; Student’s t test (A–D and I) and ANOVA (K).

