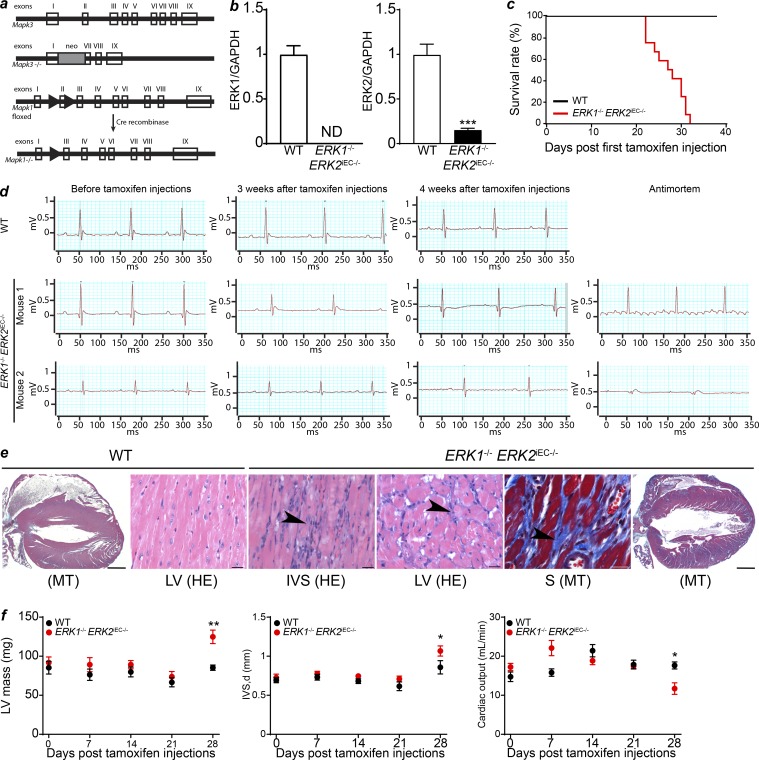
Figure 1.
Erk1−/− Erk2iEC−/− mice genotype, survival, and cardiac ECG and pathology. (a) Generation of Mapk3 (Erk1) knockout mice and Mapk1 (Erk2) conditional knockout mice. Clear boxes represent the exons of the genes. The gray box represents the neomycin cassette. Arrowheads represent LoxP sites. (b) qPCR of ERK1 and ERK2 on hepatic endothelial cells isolated from Erk1−/− Erk2iEC−/− and WT mice to assess the knockout efficiency (n = 4 mice per genotype). We found a total loss of ERK1 and an 80% decrease of ERK2 expression in cells from Erk1−/− Erk2iEC−/− mice compared with the ones from WT mice. ND, not detected. ***, P < 0.001, unpaired t test. (c) 40-d survival curves after tamoxifen injection (n = 12 mice per genotype). (d) ECG recordings of WT and Erk1−/− Erk2iEC−/− mice before tamoxifen injections, 3 and 4 wk after tamoxifen injections, and within a few hours antemortem (n = 4 mice at each time point and n = 7 for antemortem ECG. ECGs from the same mouse are presented at each time point. Two mice are presented for the Erk1−/− Erk2iEC−/− mice). (e) Representative Erk1−/− Erk2iEC−/− mice cardiac photomicrographs show suspect fibrosis (arrowheads) with the left ventricle (LV) and interventricular septum (IVS) by HE, confirmed (blue stain) by MT. Scale bars, 20 µm (n = 4 mice per genotype were analyzed). (f) Left ventricular mass, interventricular septum thickness, and calculated cardiac output evaluated by cardiac echography in Erk1−/− Erk2iEC−/− mice before tamoxifen injections and weekly after tamoxifen injections until 4 wk after injections (n = 4 mice per genotype). *, P < 0.05; **, P < 0.01; two-way ANOVA followed by Sidak’s multiple comparisons. Error bars represent SEM.

