Figure 2.
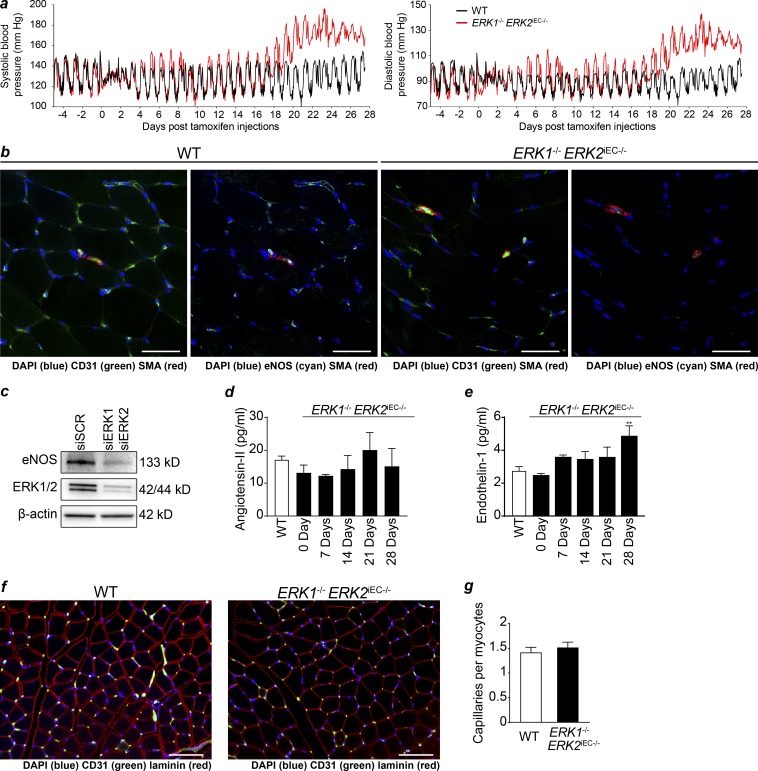
Systemic hypertension in Erk1−/− Erk2iEC−/− mice. (a) Systemic systolic (left) and diastolic (right) blood pressure in WT and Erk1−/− Erk2iEC−/− mice measured with ambulatory blood pressure transducer (n = 5 mice per genotype). (b) eNOS expression (cyan) in quadriceps with CD31 (green) and SMA (red) costaining in Erk1−/− Erk2iEC−/− mice 1 wk after tamoxifen injections (representative images from n = 4 mice per genotype). Scale bars, 50 µm. (c) eNOS expression by Western blot in HUVECs after knockdown of ERK1 and ERK2 (representative blot from n = 3). (d and e) Circulating angiotensin-II (d) and endothelin-1 (e) in plasma of Erk1−/− Erk2iEC−/− mice before tamoxifen injections and weekly after tamoxifen injections until 4 wk after injections (n = 5 mice per genotype). **, P < 0.01 using two-way ANOVA followed by Sidak’s multiple comparisons. (f and g) Capillary staining (CD31 in green) in quadriceps in Erk1−/− Erk2iEC−/− mice (f) and quantification (g; n = 6 mice per genotype). Scale bars, 100 µm. Error bars represent SEM.

