Figure 7.
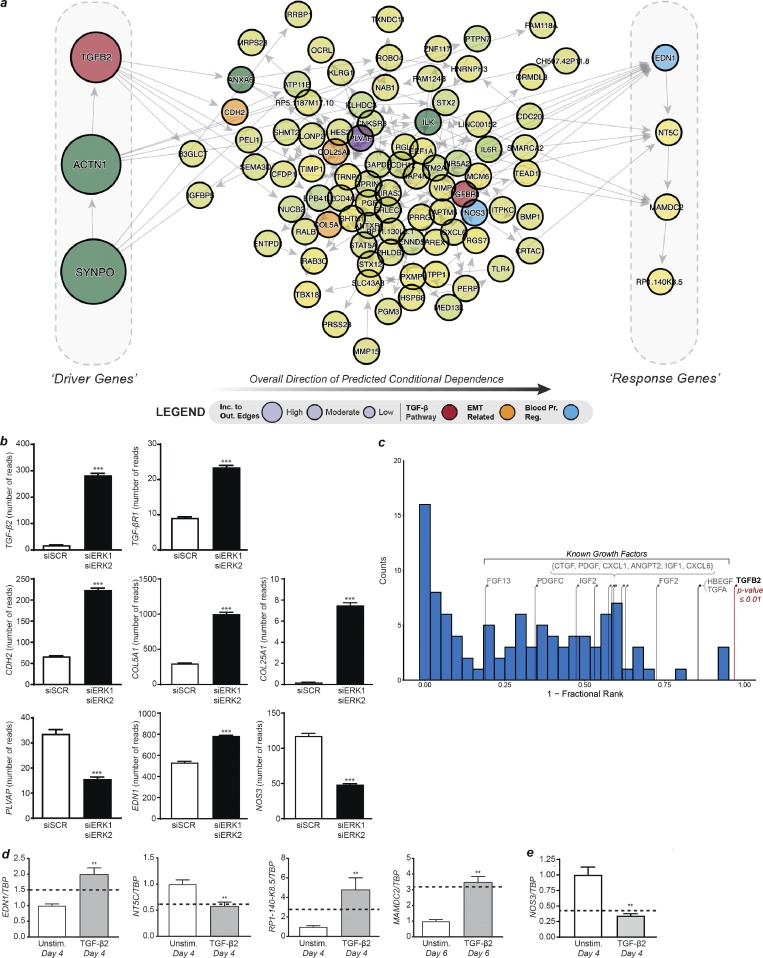
Hypothesizing and validating the causal structure between the most informative genes. (a) DAG derived from the most informative genes with the addition of TGFβ2, TGFβR1, and NOS3. Genes on the left side of the DAG are the most likely upstream causal drivers, while genes on the right are the most likely downstream targets (determined based on incoming and outgoing edges). (b) Expression levels determined by RNA-seq of genes involved in the TGFβ pathway (TGFβ2 and TGFβR1), EndMT (CDH2, COL5A1, and COL25A1), endothelial fenestration (PVLAP), and blood pressure regulation (NOS3 and EDN1) in HUVECs knocked down for ERK1 and ERK2 (n = 18 for siSCR and n = 19 for siERK1 siERK2). (c) Permutation analysis by randomly selecting genes to replace TGFβ2 (relative position shown with the red stem) and determining the relative position within the predicted BBN (Westfall–Young permutation analysis). The blue histogram shows the null distribution, while the stems indicate the relative position in the DAG of other known signaling ligands that were highly ranked by sensitivity analysis. (d) Expression levels of predicted downstream genes by qPCR after 4 or 6 d of TGFβ2 stimulation in HUVECs compared with unstimulated HUVECs. The dotted line represents the fold change in expression level of these genes in HUVECs knocked down for ERK1 and ERK2 versus control (n = 6). **, P < 0.01; Mann–Whitney U test. (e) Expression levels of NOS3 by qPCR after 4 or 6 d of TGFβ2 stimulation in HUVECs compared with unstimulated HUVECs. The dotted line represents the fold change in expression level of these genes in HUVECs knocked down for ERK1 and ERK2 versus control (n = 6). **, P < 0.01; ***, P < 0.001; Mann–Whitney U test. Error bars represent SEM.

