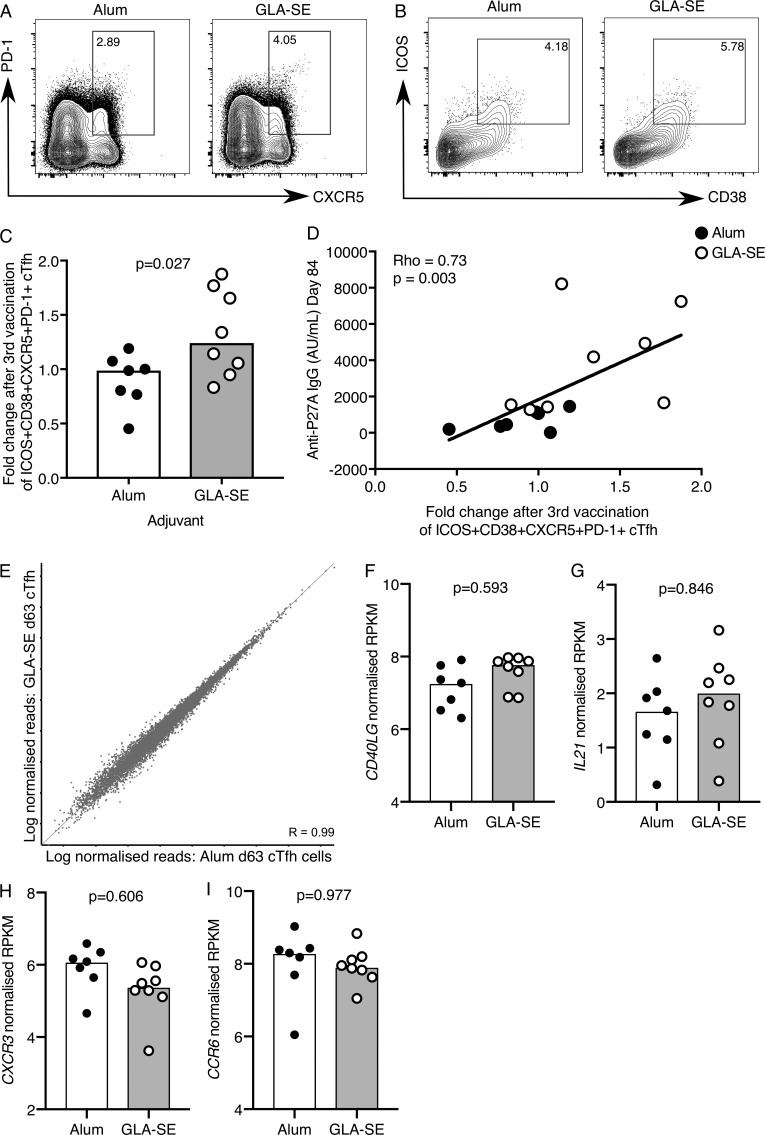
Figure 3.
A GLA-SE adjuvanted vaccine promotes cTfh expansion. (A and B) Flow cytometric contour plots of (A) PD-1 and CXCR5 on total CD45RA−CD4+CD3+ cells and (B) ICOS and CD38 on the population gated in A on peripheral blood cells from individuals 7 d after the third P27A vaccination. Alum group, n = 7; GLA-SE group, n = 8. (C) Fold change of CD38+ICOS+CXCR5+PD-1+ cTfh cells 7 d after the third P27A vaccination (frequency of cTfh cells at day 63/baseline). Alum group, n = 7; GLA-SE, group n = 8. P = 0.027. The P value is from an unpaired Student’s t test. (D) Correlation of anti-P27A IgG antibody titer 28 d after the third vaccination against fold change in CD38+ICOS+CXCR5+PD-1+ cTfh cells 7 d after the third vaccination. Rho = 0.73; P = 0.003 by Spearman’s correlation (Rho = coefficient); n = 15. (E) Scatterplot of RNA-sequencing data comparing all genes expressed in CD38+ICOS+CXCR5+PD-1+ cTfh cells 7 d after the third P27A vaccination in either Alum- (x axis) or GLA-SE– (y axis) vaccinated groups. Alum group, n = 7; GLA-SE group, n = 8. (F–I) Bar plots showing log-normalized reads from RNA-sequencing data of CD40LG. P = 0.593 (F), IL21 P = 0.846 (G), CXCR3 P = 0.606 (H), and CCR6 P = 0.977 (I) for transcripts in ICOS in CD38+ICOS+CXCR5+PD-1+ cTfh cells 7 d after the third P27A vaccination; Alum group, n = 7; GLA-SE group, n = 8. P values were calculated using DESeq2 with a false discovery rate correction. Each symbol represents one individual; those who received Alum are shown in black, and those who received GLA-SE are in white. Data are from one clinical trial.

