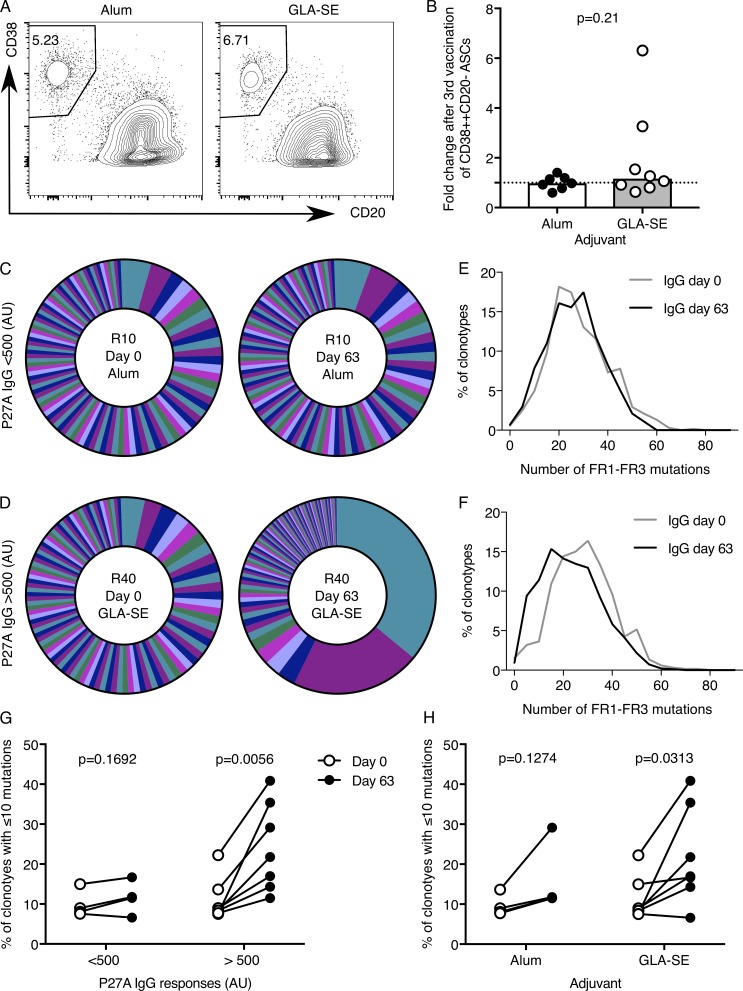
Figure 5.
V(D)J sequencing shows low BCR mutation frequency in individuals with high titer antibody responses. (A and B) Flow cytometric contour plots (A) and quantitation (B) of peripheral blood CD38+CD20− cells of total CD19+ cells 7 d after the third vaccination (day 63). Alum group, n = 7; GLA-SE group, n = 8. P = 0.21. In B, the height of the bar represents the median. P values were calculated using a Mann-Whitney U test, and each symbol represents one individual: those who received Alum are shown in black, and those who received GLA-SE are in white. (C and D) Pie charts of the proportions of the 100 most abundant IgHG clonotypes in CD38+CD20−CD19+ ASCs from C, a representative individual whose anti-P27A IgG does not increase >500 AU after the third vaccination (day 84–day 0), and D, a representative individual who has a high anti-P27A titer after the third vaccination (day 84 to day 0). Each segment of the pie chart represents a unique BCR clonotype. (E and F) Line graphs of the number of mutations in the V region of each clonotype (FR1–FR3, excluding CDR3, binned into five mutation bins) for the individuals shown in A and B, respectively, at the indicated time points relative to vaccination. (G and H) The percentage of IgHG clonotypes with ≤10 mutations in low (n = 4; P = 0.1692) and high antibody responders (n = 7; P = 0.0056; G) and in the different adjuvant groups, Alum group n = 4, P = 0.1274; GLA-SE group n = 7, P = 0.0313 (H). In G and H, each individual is connected with a line between their day 0 and day 63 samples. The P values were from a paired Student’s t test. Individual participants’ clonotype data for all other samples that passed sequencing quality control are included as Fig. S4. Data are from one clinical trial.

