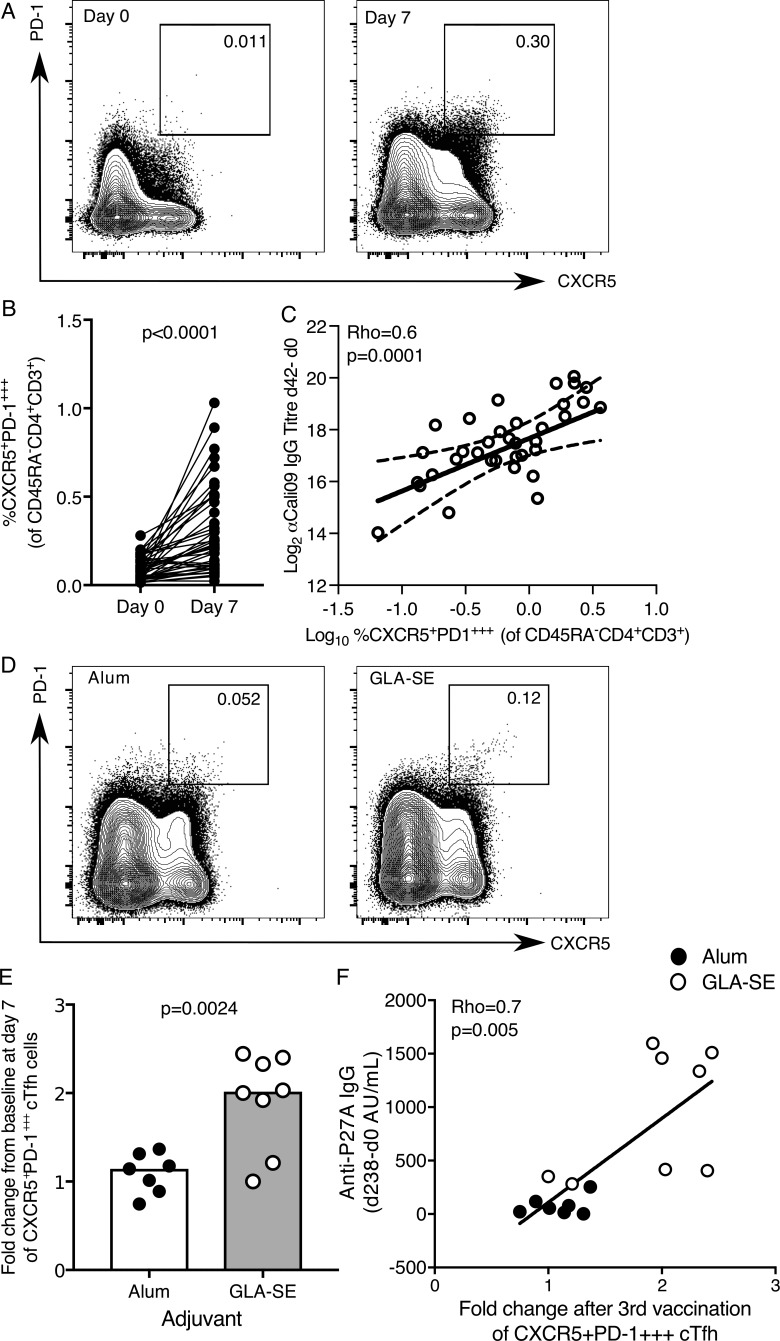
Figure 7.
The expansion of CXCR5+PD-1+++ cTfh cells is enhanced by a GLA-SE adjuvanted vaccine. (A and B) Flow cytometric contour plots (A) and quantification (B) of the frequency of CXCR5+PD-1+++ cells among CD45RA−CD4+CD3+ cells in the peripheral blood of healthy UK donors at days 0 and 7 relative to seasonal influenza vaccination; n = 41; in B, each symbol represents a volunteer, and an individual donor is connected by a line at the two time points; n = 41. P < 0.0001. The P value was calculated using Wilcoxon signed-rank test. (C) Correlation of the frequency of CXCR5+PD-1+++ cTfh cells 42 d after vaccination with the change in antibody titer of anti-Cal09 IgG (an influenza A HA); Rho = 0.6; P = 0.0001 using Spearman’s correlation (Rho = correlation coefficient). (D) Flow cytometric contour plots of CXCR5+PD-1+++ of total CD4+CD3+CD45RA− cells 7 d after the third P27A vaccination. Alum group, n = 7; GLA-SE group, n = 8. (E) Fold change of CXCR5+PD-1+++ cTfh cells 7 d after the third P27A vaccination (frequency of cTfh cells at day 63/baseline). Alum group, n = 7; GLA-SE group, n = 8. P = 0.0024. The P value is from an unpaired Student’s t test. (F) Correlation of the increase in anti-P27A IgG antibody titer 238 d after the first vaccination (relative to baseline) against the fold change in CXCR5+PD-1+++ cTfh cells 7 d after the third vaccination (day 63); n = 15. Rho = 0.7; P = 0.005 using Spearman’s correlation. Each symbol represents one individual; those who received Alum are shown in black, and those who received GLA-SE are in white. Data are from one clinical trial.

