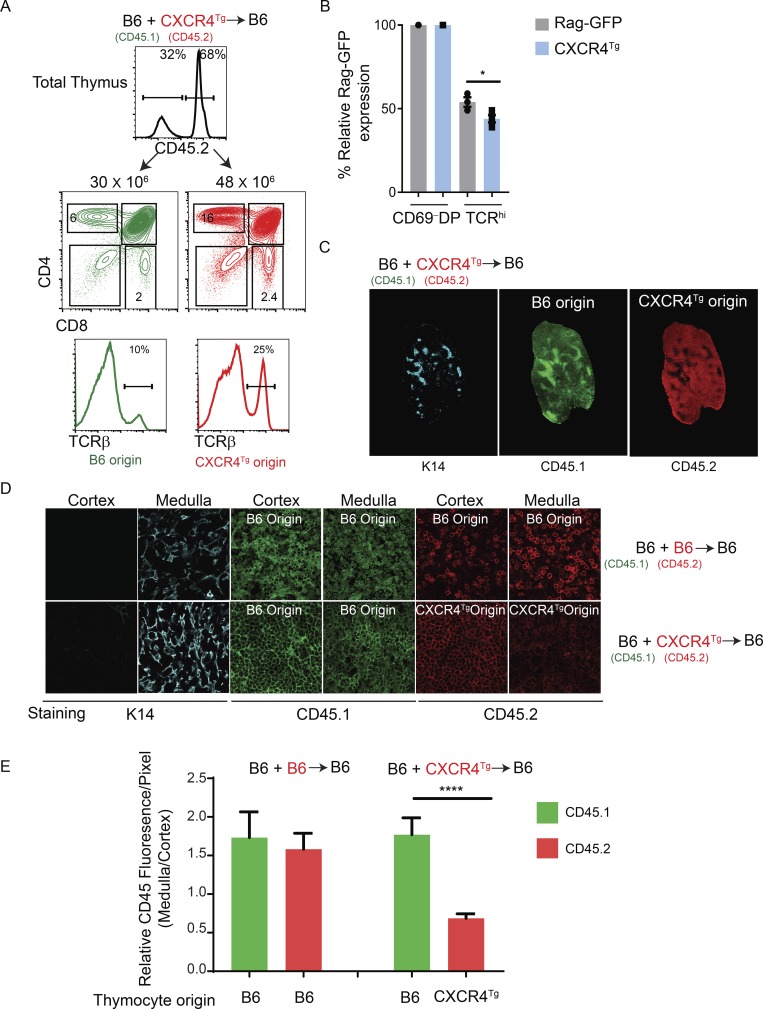
Figure 7.
Transgenic CXCR4 expression inhibits migration of TCR-signaled thymocytes from the cortex into the medulla. (A) Mixed donor radiation bone marrow chimers were constructed by injecting B6 (CD45.1) and CXCR4Tg (CD45.2) bone marrow into lethally irradiated (950 rad) B6 (CD45.1) host mice. Top profile shows CD45.2 staining of thymocytes 8–10 wk after bone marrow reconstitution and reveals the frequency of thymocytes derived from each donor bone marrow. Middle panel shows CD4/CD8 profiles of B6 and CXCR4Tg donor origin thymocytes. Numbers on top of histograms indicate number of donor origin thymocytes. Numbers within the boxes indicate frequency of thymocytes within that box. Bottom panel shows TCRβ profiles on total thymus of the indicated origin from radiation mixed chimeric mice, with the frequency of TCRβhi cells indicated. (B) Bar graph displaying relative Rag-GFP expression on postselection TCRhi thymocytes normalized to preselection CD69− DP thymocytes from each strain. (C) Whole-tissue mosaics of thymus sections (10×) immunolabeled for K14 (cyan), CD45.1 (green), and CD45.2 (red) from B6+CXCR4Tg radiation mixed bone marrow chimera. (D) Higher-magnification (63×) fluorescence images of thymus sections immunolabeled for K14 (cyan), CD45.1 (green), and CD45.2 (red) from the indicated radiation mixed chimeric mice. (E) MFI of CD45 staining in the medulla was normalized to that in the cortex of individual mixed-donor bone marrow chimeric thymi. Each bar represents 7–13 individual measurements from 2–3 different thymi. The normalized signal intensities for both CD45.2 and CD45.1 are displayed as bar graphs. *, P < 0.05; ****, P < 0.0001 determined by Student’s t test. Data are from two to five experiments with five mice per genotype (A–C).

