Figure 3.
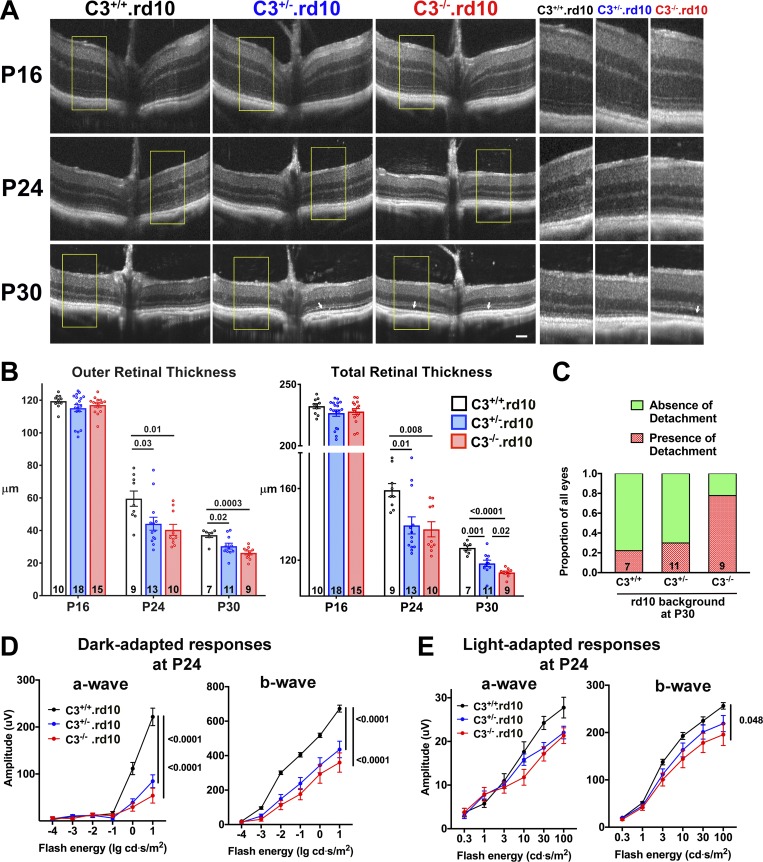
In vivo structural and functional evidence of accelerated photoreceptor degeneration in C3-deficient rd10 mice. (A) OCT imaging was performed in rd10 mice that had been genetically ablated for C3 before (P16) and during (P24, P30) rod degeneration; littermates of the three genotypes were analyzed and compared. Insets (yellow boxes) show magnified and juxtaposed images comparing corresponding retinal areas. (B) Quantification of outer (from OPL to RPE) and total (from vitreal surface to the RPE) retinal thicknesses demonstrated statistical similarity between the three genotypes at P16 but accelerated thinning in C3+/−.rd10 and C3−/−.rd10 animals (number of eyes analyzed per group provided at the bottom of each column). (C) Analysis of retinal detachments observed (white arrows in A); the relative prevalence of such detachments at P30 was highest in C3−/−.rd10 and lowest in C3+/+.rd10 animals. (D) ERG evaluation at P24 demonstrated decreased dark-adapted, rod-dominant a- and b-wave amplitudes in C3+/−.rd10 and C3−/−.rd10 relative to C3+/+.rd10 animals. (E) Light-adapted, cone-mediated responses were similar in a-wave amplitudes, but slightly decreased in b-wave amplitudes for C3−/−.rd10 relative to C3+/+.rd10 animals (number of eyes analyzed: C3+/+.rd10 = 12; C3+/−.rd10 = 11, and C3−/−.rd10 = 9). P values derived from a two-way ANOVA with Tukey’s multiple comparisons test; data collected from five and three independent experiments for OCT and ERG, respectively. All data shown as mean ± SEM.

