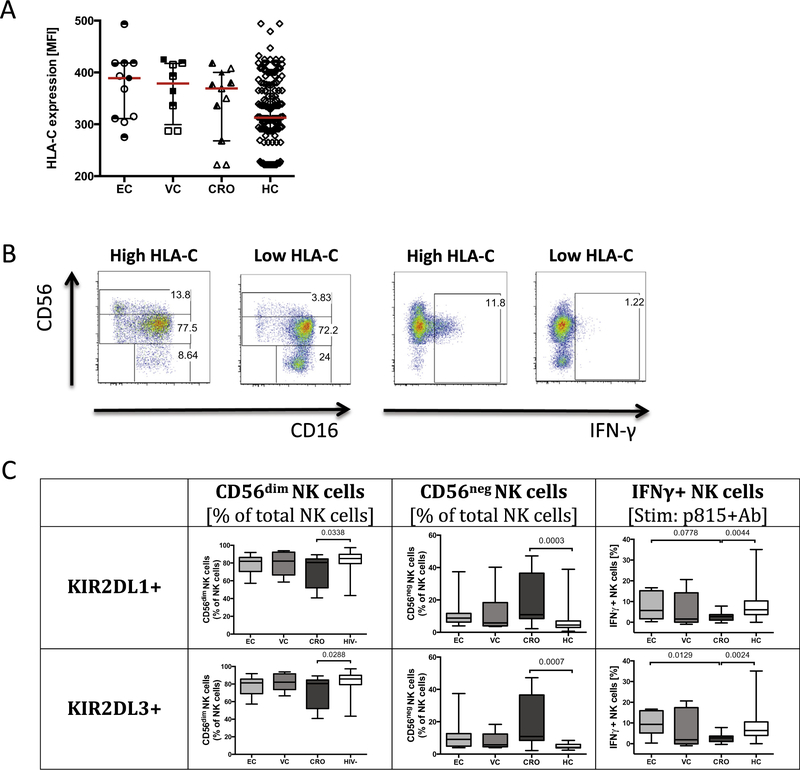
Fig. 2.
Impact of HLA-C expression on NK cell subset distribution and function among HIV-1 infected subjects. Predicted HLA-C expression levels are depicted based on individual HLA-C allotypes (A) and show differential levels among clinical subgroups including elite controllers (EC), n = 11; viremic controllers (VC), n = 8; chronic progressors (CRO), n = 10, healthy controls (HC), n = 154. Open shapes indicate subjects in the HLA-C1/C1 group, half-open shapes represent subjects in the HLA-C1/C2 group; and closed shapes represent subjects in the HLA-C2/C2. The flow plots illustrate the differences in NK cell subset distribution and IFN-γ secretion in subjects with low or high HLA-C expression (B). The differences in NK subset distribution and IFN-γ secretion are illustrated in subjects expressing KIR2DL1 and KIR2DL3 (C).

