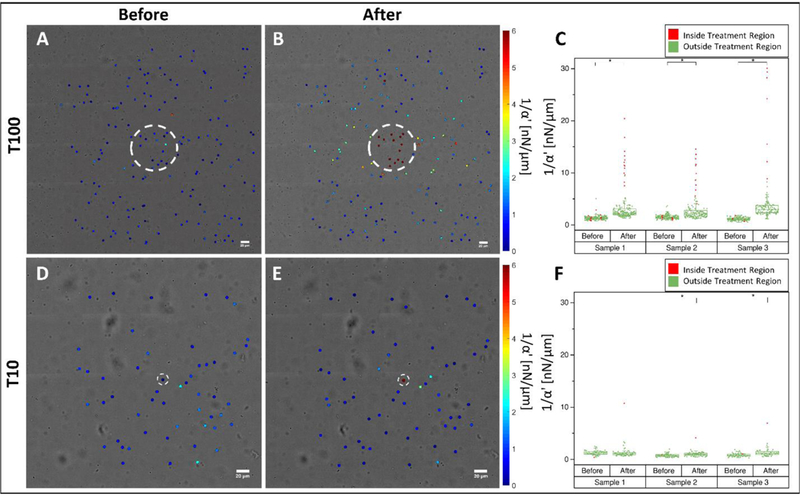
Figure 4.

Distribution of stiffness within a fibrin hydrogel probed by AMR before and after T100 and T10 treatments. Stiffness maps (A) before and (B) after T100 treatment. (C) Scatter plot of all T100 samples before and after treatment. Stiffness maps (D) before and (E) after T10 treatment. (F) Scatter plot of all T10 samples before and after treatment. (*) denotes significance at 0.05 level via a Mann-Whitney U-Test. Color maps in (A, B, D, E) saturate at 6 nN/μm. Scale bars = 20 μm.
