Figure 5.

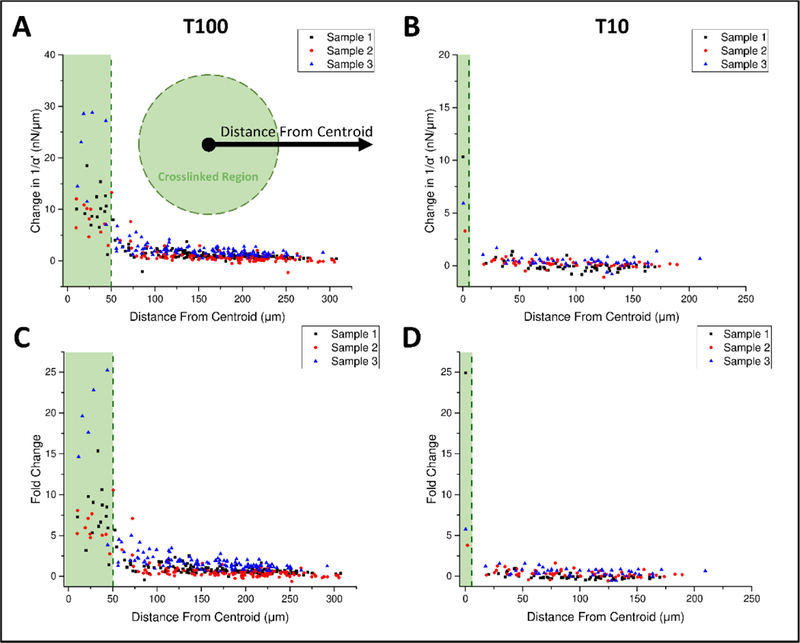
Stiffening decreases with radial distance from treated region center. Stiffening for (A) T100 and (B) T10 samples as a function of distance from the treatment area center. Treatment region shaded in green. Fold change presented in (C) and (D) for T100 and T10, respectively. Dotted lines mark the outer radius of the treatment area. (nsamples= 3, per treatment type).
