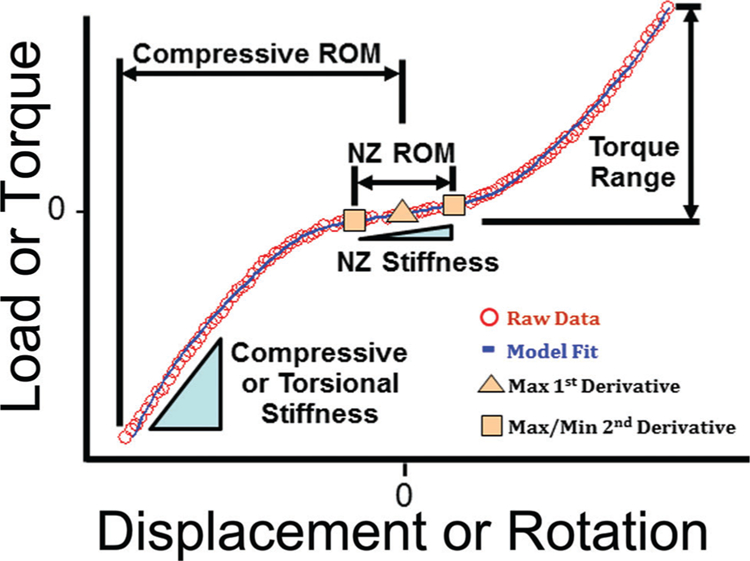
Figure 3.

Loading curves were isolated from the final test cycle to analyze compression and torsion data. Positive (tension or counter-clockwise rotation) and negative (compression or clockwise rotation) curves were made to intersect by shifting each to the load axis to form a composite curve which was subsequently fit to a sigmoid function. The maximum of the 1st derivative (maximum compliance) of the function represents the transition from positive to negative loading. The extremum of the 2nd derivative represent the boundaries of the NZ. NZ stiffness (for compression/tension and torsion) was defined as the slope of the line connecting the point at the each boundary of the NZ. NZ ROM (for compression/tension and torsion) was defined as the displacement between these points. Compressive ROM was defined as the displacement between the inflection point of the curve and the displacement at −1.3 MPa, a value of stress that consistently occurred just prior to the peak stress (the peak stress varied slightly from test to test). Compressive stiffness was defined from the raw data as the slope of the line fit from −1.3 to −0.5 MPa (a value that consistently occurred after the transition region). Torque range was defined as the change in torque from the inflection point of the curve to the maximum torsional load. Torsional stiffness was defined from the raw data by fitting a line from 40% to 90% of the maximum torque for both positive and negative rotations and then averaging the two.
