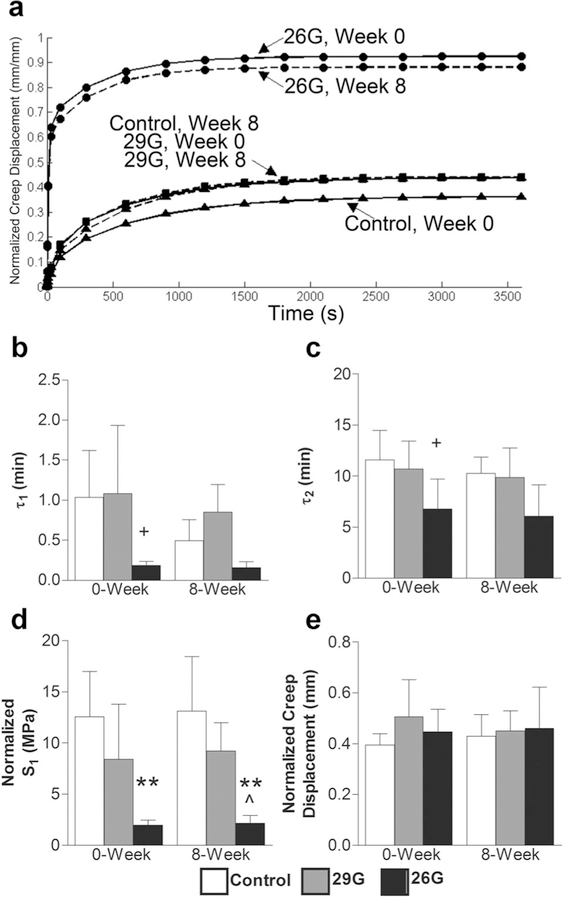
Figure 7.
(a) Average creep curves calculated from mean parameter values in Equation 1. The total response (initial step displacement plus creep displacement) was magnified by puncture while the creep displacement did not change. The data are displayed as: control (triangles), 29G (squares), 26G (circles) with 0-week (solid line) and 8-week (dotted line). (b) Early time constant, τ1, (c) late time constant, τ2, (d) normalized early damping stiffness, S1, (e) and normalized creep displacement (n = 5/group/timepoint). Differences from control at each time are labeled as significant (**p < 0.001, *p < 0.05), and trend (+p < 0.10). Significant differences from 29G are labeled as (^p < 0.05).

