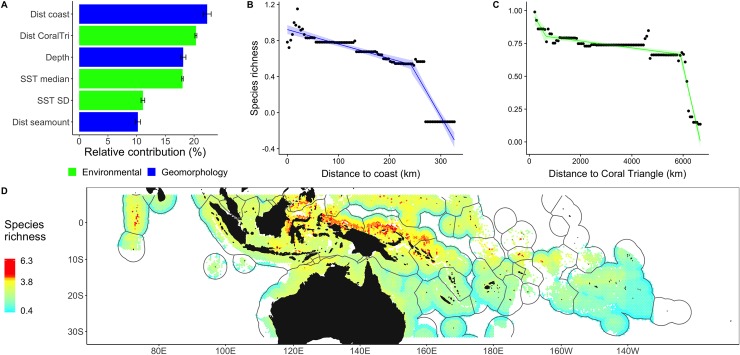
Fig 3. Drivers and patterns of vertebrate species richness in the Indo-Pacific.
(A) Relative contribution of main drivers explaining variations in species richness were generated from 100 iterations of BRTs. (B, C) Partial dependence plot (lines), observed values (dots), and 95% confidence intervals for distance to the coast (B) and SST. (D) Predictions of species richness (top 5% values, >3.8, in red). The numerical values for (A) can be found in S2 Data. BRT, boosted regression tree; dist coast, distance to nearest coast; dist CoralTri, distance to the Coral Triangle; dist seamount, distance to nearest seamount with summit depth <1,500 m; SST, sea surface temperature.

