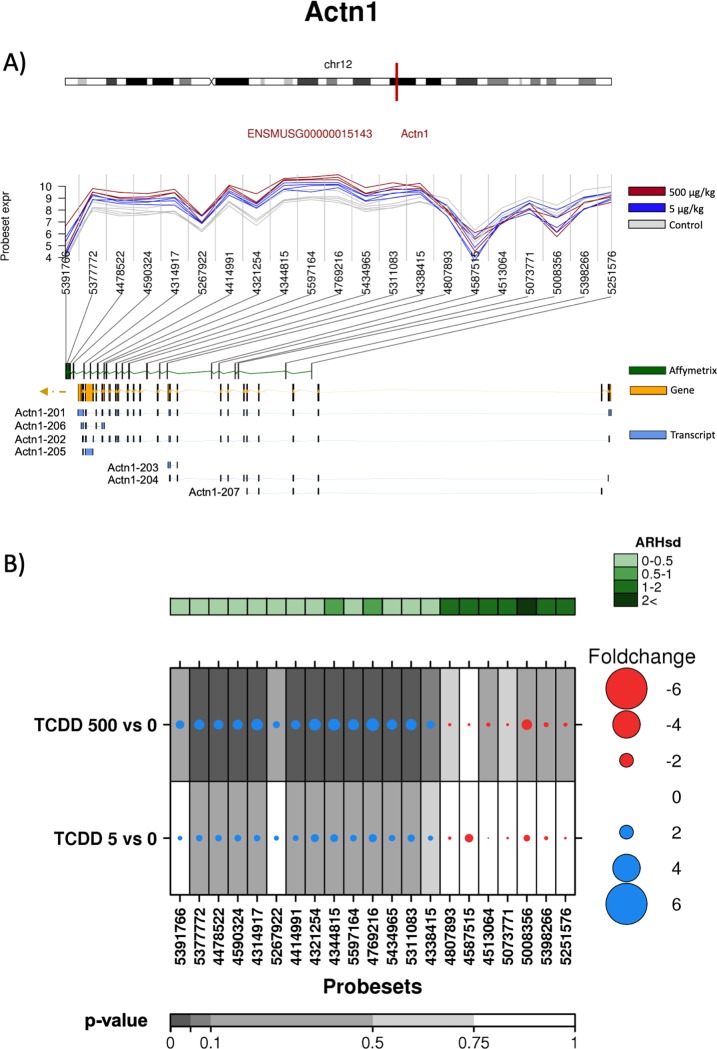
Fig 8. Analysis of the effect of TCDD on exonic abundances of Actn1.
A) Localization and normalized abundances of ProbeSets targeting distinct exons within the Actn1 gene. Upper panel: chromosome 12 structure and Actn1 localization (red line). Middle panel: Log2 of the intensities for each of the probes targeting regions within this gene, control (gray lines), low dose TCDD 5 μg/kg (fuchsia lines) and high dose TCDD 500 μg/kg (brown lines). Bottom panel: Comparative structure of known Actn1 isoforms. Gene reference, including direction of the transcription (yellow), transcripts as reported by Ensembl (blue) and Affymetrix microarray ProbeSets (green). B) RNA abundance of each ProbeSet was contrasted between TCDD treated mouse liver (5 or 500 μg/kg separately) and controls. Dotmap shows the differential abundances for each ProbeSet for each group; such that red dots show reduced abundance following TCDD exposure, while blue shows increased abundance. Dot size represents the magnitude of change. Background shading indicates significant of change, as quantified by the bottom gray bar (FDR adjusted p-value). Top green covariate bar represents the ARH value (with darker shading indicating higher intensity).

